The Histogram shows you the distribution, the central tendency and the scatter or variability of the sample data, and calculates process capability.
The following is an example of a Histogram created using the SPC ActiveX Control:
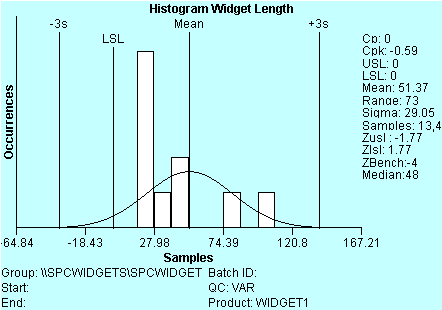
![]() Histogram chart calculations.
Histogram chart calculations.
![]() SPC chart types.
SPC chart types.