Open a new PRT Graphic Display Configuration dialog box as follows:
Expand the PRT folder in the Tracker Configuration left pane.
Expand the Advanced folder.
Double-click Graphics Display.
A list box displays in the right pane.
Click ![]() in the right pane.
in the right pane.
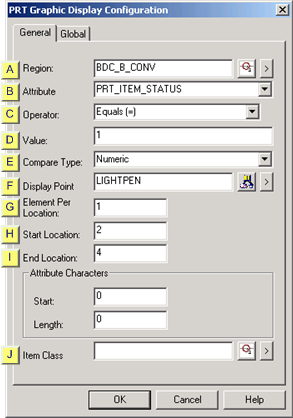
The PRT Graphics Display Configuration dialog box opens.
Select the General tab.
|
Region |
|
|
Attribute |
|
|
Operator |
|
|
Value |
|
|
Compare Type |
|
|
Display Point |
|
|
Element Per Location |
|
|
Start Location |
|
|
End Location |
|
|
Item Class |
|
Region |
Select or create a new region using the standard Tracker region controls.
|
Attribute |
Select the attribute you want to operate on.
|
Operator |
The currently defined operators are:
|
Count operators |
These operators will perform a count of attribute data matching the user specified value.
|
|
Display operators |
A special operator that will simply copy the specified attribute for each item in the region to an array point.
|
|
Value |
Value entries depend upon the selected operator.
|
Count operators |
Count up all attributes that meet the operator defined criteria. |
|
Display operators |
The value is not used. |
|
Compare Type |
Compare Type entries depend on the selected operator.
|
Count operators |
The attribute value and the user value will be converted to this type and then the operator comparison will be performed. |
|
Display operators |
This field is not used. |
|
Display Point |
Display point entries depend on the selected operator.
|
Count operators |
The Point may be numeric or text. The total of all items in the region matching the operator criteria will be entered into this field. |
||
|
Display operators |
This must be an array point. The point may be numeric or text. The data will be converted to match the point type. Each element in the array will represent a location in the region. The Item Class ID defined for this graphic display record will control filling of the array.
|
||
|
|
Array |
Item |
|
|
|
0 |
1 |
|
|
|
1 |
1 |
|
|
|
2 |
2 |
|
|
|
3 |
2 |
|
|
|
4 |
3 |
|
|
|
4 |
3 |
|
|
|
5 |
4 |
|
|
|
6 |
4 |
|
![]() Note: If a location only contains 1 item, the
array will contain an empty element for the missing location.
Note: If a location only contains 1 item, the
array will contain an empty element for the missing location.
Guidelines for display points:
|
Attribute |
Point Guideline |
|
PRT_ASSOC_ITEM |
Text point that must define a text size of at least 20. |
|
PRT_ITEM_ID |
Text point that must define a text size of at least 20. |
|
PRT_ITEM_STATUS |
Analog point that must be of type ANALOG_U32. |
|
PRT_ITEM_TYPE_ID |
Text point that must define a text size of at least 20. |
|
PRT_REFERENCE_ID |
Text point that must define a text size of at least 20. |
|
USER DEFINED |
Text point with the number of region locations covered by the point equaling the number of elements in the array. Calculate elements as follows: End location – Start Location +1. |
|
Element per Location |
The same number as items per location.
The display views an array point that is designed to collect an element that is in a particular location.
For example a region has 10 locations. An array point has 10 elements. It can hold each location in an element. The point can hold 10 locations in the array.
|
Start Location |
Starting location in the region where counting or displaying is to start.
|
Locations to send to a |
Enter |
||
|
Going in the direction of the Start to End of region |
|||
|
|
|
|
|
|
All locations |
Start location |
0 |
|
|
End location |
0 |
||
|
Range of specific locations |
Start location |
Number of the Start location. |
|
|
End location |
Number of the End location. |
||
|
All locations after a start location |
Start location |
Number of the Start location |
|
|
End location |
0 |
||
|
|
Example |
|
|
|
|
Start Location |
1 |
|
|
|
End Location |
10 |
|
|
|
Locations sent to a point |
Locations 1 - 10. |
|
|
Going in the direction of the End to Start of region |
|||
|
Range of specific locations |
Start location |
1 (End location in the region) |
|
|
End location |
<x> Where X is the number of locations to be included going from end to start. |
||
|
End Location |
Ending location in the region where counting is displaying is to end.
Attribute characters
|
Start |
Starting position in the attribute value to be displayed |
|
End |
Ending position in the attribute value to be displayed. |
|
Item Class |
Leave blank for all. The item class to be included.
Click OK.
Result: The graphic display configuration is added to your Tracking Model.
|
|
Option 9.1. PRT graphics display. |