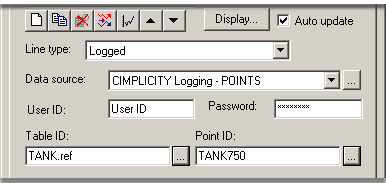
Logged lines display data from a CIMPLICITY Database Logger group table. This type of trend is also called an historical trend because all the information comes from logged data.
Enter the following.

|
Option |
Description |
||
|
LIne type |
Logged |
||
|
Data source |
ODBC data source. |
||
|
|
Default |
CIMPLICITY Logging - POINTS |
|
|
|
|
Opens the ODBC Data Source Administrator |
|
|
User ID |
(Optional) User authorized to access the logged data |
||
|
Password |
(Optional) Valid password for authorized user. |
||
|
|
|
Opens a Select a Table/Column browser. |
|
|
Table ID |
Point logging table ID in the data source |
||
|
|
|
Opens the Select a Table/Column browser for an authorized user. |
|
|
Point ID |
Point in the logging table. |
||
|
|
|
Opens the Select a Table/Column browser for an authorized user. |
|
|
Auto update |
Check |
Automatically update the line. |
|
|
|
Clear |
Keep the same historical information as a reference. |
|
![]() Important:
Important:
![]() The source for a Logged
line is always a column in a group log
table.
The source for a Logged
line is always a column in a group log
table.
![]() A group log table has one column per point, one row
for all points.
A group log table has one column per point, one row
for all points.
![]() Logging array points to
Data log tables is currently not supported. As a result, trending
array points from data log tables is not supported. Use group
tables for array points.
Logging array points to
Data log tables is currently not supported. As a result, trending
array points from data log tables is not supported. Use group
tables for array points.
![]() Note: Logged lines can
always be scrolled. If you clear Auto
update, the line will update when it is scrolled.
Note: Logged lines can
always be scrolled. If you clear Auto
update, the line will update when it is scrolled.
|
Option 4.2. Create a New Trend Chart Line (Overview of Detailed Method). |