Lines using logged and runtime data first display a combination of logged and runtime data.
![]() Runtime data is reported by
CIMPLICITY Point Management.
Runtime data is reported by
CIMPLICITY Point Management.
![]() Logged data comes from a
CIMPLICITY Log table.
Logged data comes from a
CIMPLICITY Log table.
|
Configure a Logged Expression line |
|
|
Logged Expression lines and scrolling configuration |
|
|
Qualified points and logged expression lines |
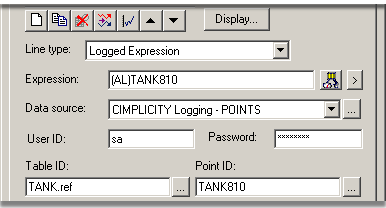
Configure a logged expression line
Enter the following.

|
Option |
Description |
||
|
LIne type |
Logged |
||
|
Expression |
One or more point ID's and mathematical operators that can be evaluated. |
||
|
Data source |
ODBC data source. |
||
|
|
Default |
CIMPLICITY Logging - POINTS |
|
|
|
|
Opens the ODBC Data Source Administrator |
|
|
User ID |
(Optional) User authorized to access the logged data |
||
|
Password |
(Optional) Valid password for authorized user. |
||
|
|
|
Opens a Select a Table/Column browser. |
|
|
Table ID |
Point logging table ID in the data source |
||
|
|
|
Opens the Select a Table/Column browser for an authorized user. |
|
|
Point ID |
Point in the logging table. |
||
|
|
|
Opens the Select a Table/Column browser for an authorized user. |
|
|
Auto update |
Check |
Automatically update the line. |
|
|
|
Clear |
Keep the same historical information as a reference. |
|
![]() Important: Logging
array points to Data log tables is currently not supported. As a
result, trending array points from data log tables is not
supported. Use group tables for array points.
Important: Logging
array points to Data log tables is currently not supported. As a
result, trending array points from data log tables is not
supported. Use group tables for array points.
Logged Expression lines and scrolling configuration
The behavior of the logged expression line type depends on how scrolling is configured on the Chart tab as follows:
|
Selection |
Behavior |
|
Allow runtime scrolling and: |
|
|
Jump to current value |
The Scroll Percentage determines the amount of run-time data used. The rest of the data comes from the log table. |
|
|
Example |
|
|
Configure a chart to display a 2-hour time duration. |
|
|
Set the Scroll Percentage to 25. |
|
|
During the display the: |
|
|
First hour and a half (1 ½) comes from the log table |
|
|
Last ½ comes from run-time data. |
|
|
You cannot scroll logged expression lines when Allow runtime scrolling is not selected. In addition, the Trend will always draw in Jump Scroll mode. |
|
All other options |
The Scroll Percentage no longer determines the amount of runtime data used. The line displays up to one chart page worth of runtime data. The rest of the data comes from the log table. |
|
|
You can scroll logged expression lines when Allow runtime scrolling is selected. |
Qualified points and logged expression lines
If you do not specify a project, the Base project is used.
If you change the Base project on the Chart tab of the CIMPLICITY Trend Control Properties dialog box and:
|
If a Point ID |
Trending |
|
Is fully qualified |
Continues to draw the line using the same data source. |
|
Is not fully qualified |
Trending assumes the data is coming from the base project. If you change the base project, Trending attempts to find the point in the new base project. |
This feature is useful if you have two or more projects with the same Point ID (for example, BLDG_1 project and BLDG_2 project) and you want to be able to switch between them.
![]() Note: One of the sources for a Logged
expression line is always a column in a group log
table.
Note: One of the sources for a Logged
expression line is always a column in a group log
table.
|
|
About Logged Expression Lines and Scrolling Configuration. |
|
Logged Expression Lines and Qualified Points. |
|
|
Procedure to Disable Logged Expression Line Scrolling. |
|
|
Option 4.2. Create a New Trend Chart Line (Overview of Detailed Method). |