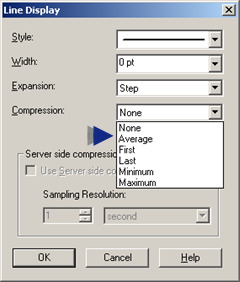
If you select a compression type for a line type that is not a logged line, Trending:
![]() Automatically determines the group
size that the data point represents..
Automatically determines the group
size that the data point represents..
![]() Applies the selected compression
method (for example, average) to that group.
Applies the selected compression
method (for example, average) to that group.
![]() Plots all the data points in the
group as a single data point as follows:
Plots all the data points in the
group as a single data point as follows:
Select compression for a line type that does not have historical data:
(If the Line Display dialog box is not open) Open the Line Display dialog box.
Select a line in the Lines grid.
Click .
The Line Display dialog box opens.
Select a compression type in the Compression field to display one of the following plotted values.

|
Compression Type |
Plotted Value |
|
None |
Multiple data points along a vertical line. |
|
Average |
The average of the values within the automatically determined group size. |
|
First |
First value in the group |
|
Last |
Last value in the group |
|
Minimum |
Minimum value in the group |
|
Maximum |
Maximum value in the group |
![]() Note: Server side compression is only available
for lines with historical data.
Note: Server side compression is only available
for lines with historical data.
|
Option 5.2. Trend Line Compression or Sample Type. |