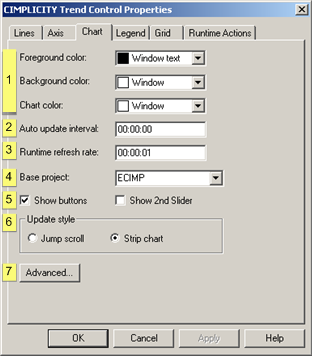
Select the Chart tab in the CIMPLICITY Trend Control Properties dialog box.
Chart options are as follows.
|
Chart colors |
|
|
Auto-update interval |
|
|
Runtime refresh rate |
|
|
Base project |
|
|
Show buttons/Show 2nd Slider |
|
|
Update style |
|
|
Advanced |
|
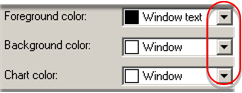
Chart colors |
Click each color field's Palette button to configure the chart's colors:
|
Field |
Selects color for the: |
|
Foreground color |
Slider, legend and chart X and Y-axes |
|
|
Default Color: CimEdit ambient Fore color. |
|
Background color |
Area surrounding the trend chart |
|
|
Default Color: CimEdit ambient Back color. |
|
Chart color |
Solid color for the trend chart area |
|
|
Default Color: CimEdit ambient Back color. |
|
Auto update interval |
The time between one new data update and the next.
The format is hh:mm:ss.
Example
10 equals ten seconds; 1:00 equals one minute.
![]() Note: Auto update will only occur for lines that
have Auto Update selected on the
Line tab of the CIMPLICITY Trend Control Properties dialog box.
Note: Auto update will only occur for lines that
have Auto Update selected on the
Line tab of the CIMPLICITY Trend Control Properties dialog box.
|
Runtime refresh rate |
The time between one time that the chart redraws itself and the next.
The format is hh:mm:ss.
|
Base project |
The CIMPLICITY project to be used for any unqualified Point IDs.
The default is provided by CimView, but can be changed at runtime.
![]() Trending goes step-by-step, in the
following order of priority, to find the project that contains the
unqualified points.
Trending goes step-by-step, in the
following order of priority, to find the project that contains the
unqualified points.
![]() The step that proves positive is
the one Trending uses to determine the project name.
The step that proves positive is
the one Trending uses to determine the project name.
![]() Each step applies to both Server
and Viewer, unless otherwise noted:
Each step applies to both Server
and Viewer, unless otherwise noted:
|
Priority |
Project is used to fully qualify any Unqualified Point IDs when |
|
A |
In CimView, an Open screen or Overlay screen action specifies a project. When a user opens the screen that contains the Trend chart using one of these actions, the project specified in the action is used. |
|
B |
A command line is used to open the CimView screen that contains the Trend chart and the /project option is used, that project is used. |
|
C |
The screen that contains the Trend chart is in a project directory, that project is used. |
|
D |
The project name in the Trend chart property page is not blank, that project is used. |
|
E |
You are on a Server and a single project is currently running, that project is used. |
|
F |
You are on a Server and multiple projects are running, the project that was started first is used. However, you can modify this behavior using the PROJECT_ID global parameter. |
|
G |
You are on a Viewer, and none of the above conditions are positive, unqualified Point IDs are unavailable. |
|
Show buttons/Show 2nd Slider |
(Optional) Check to display the following during runtime.
|
Checkbox |
Displays |
|
Show buttons |
Scroll buttons. |
|
Show 2nd slider |
A second slider. Note: You can choose to display second slider values in the Legend and /or Status bar during runtime. You enable the options on the Legend tab in the CIMPLICITY Trend Control Properties dialog box. |
|
Update Style |
Check one of the following to choose an update style
|
Radio button |
Description |
|
Jump Scroll |
The line: |
|
|
|
|
Strip Chart |
The line: |
|
|
|
|
Advanced |
(Optional) click to open the Advanced dialog box.
|
|
Color and Font Choices on a Trend Chart. |
|
|
Step 7. Configure Chart Properties. |