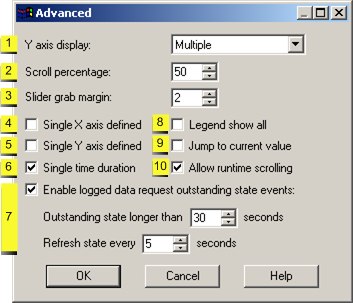
The Y-axis display, scroll percentage, slider grab margin and other miscellaneous chart features can be specified in the Chart tab's Advanced dialog box.
Click on the Chart tab in the CIMPLICITY Trend Control Properties dialog box.
The Advanced dialog box opens.
Options are as follows.
|
Y axis display |
Y-axis to display in the Y-axis display field.
Choices are:
|
Multiple (Default) |
Display all the currently configured Y-axes that are not hidden |
|
Single |
Display the chart Y-axis only |
|
Percent Configured |
Display a single Y-axis going from 0 to 100 percent. All the lines are displayed on a scale of 0 to 100 percent of their ranges as configured on the Axis property page. |
|
Scroll percentage |
Percent that defines the:
![]() Time duration that the chart data
will Scroll backward or forward when the
Time duration that the chart data
will Scroll backward or forward when the ![]() or
or ![]() button is pressed during
runtime.
button is pressed during
runtime.
![]() Length of the jump when the
drawing reaches the right edge of the chart if you set the
Update style to Jump scroll in the basic
Chart tab.
Length of the jump when the
drawing reaches the right edge of the chart if you set the
Update style to Jump scroll in the basic
Chart tab.
Example of button scroll
A chart displays a 2-hour time duration
Enter 25 in this field.
The chart will scroll backward or forward by a half-hour (25% of two (2) hours) when the scroll button is pressed.
|
Slider grab margin |
The number of pixels from the slider that a mouse cursor can move and still grab the slider.
The entry can be a number from 0 - 10.
|
Single X-axis defined |
|
Checked |
The chart displays with a single X-axis referred to as the Chart X axis. All lines will use the Chart X Axis. |
|
Clear |
The chart can display with more than one X-axis. |
Note: For Line charts that represent time, this option is mutually exclusive with the Single Time Duration option. Therefore, if you select this option, the Single time duration check box will be unavailable.
|
Single Y-axis defined |
|
Checked |
The chart displays with a single Y-axis referred to as the Chart Y axis. All lines will use the Chart Y-axis. |
|
Clear |
The chart can display with more than one Y-axis. |
Note: If you select this option, the Y-axis display will be disabled.
|
Single time duration |
|
Checked |
All of the lines in the chart use a single time duration. |
|
Clear |
The lines in the chart can use different time durations. |
The time duration is the Chart X Axis duration, for example, you can view the data for all lines for a span of two hours, regardless of start time.
Note: For Line charts that represent time, this option is mutually exclusive with the Single X-axis option.
|
Enable logged data to request outstanding state events |
Check to enable a wait state event.
Specify the following.
|
Field |
Description |
|
Outstanding state longer than N seconds |
Wait time, in seconds, at which a request for logged data is considered outstanding. |
|
Refresh state every N seconds |
Interval, in seconds, at which the Trend control checks if it has any logged requests that have been outstanding for more than the Threshold. |
|
Legend show all |
|
Checked |
Displays the legend information for all visible and hidden lines on the chart. |
|
Clear |
Displays information for only the visible lines on the chart. |
Note: Use the Legend tab to define the legend elements.
|
Jump to current value |
|
Checked |
The trend display automatically jumps back to the current time at the next runtime or auto update timer interval, whenever a user scrolls the chart. |
|
Clear |
Must scroll manually to return to the current time. If one of the objects on the CimView screen has a JumpToCurrentTime method configured for the chart, you can use that method to scroll forward to the current time. |
Jump to current value combined with Allow Runtime Scrolling affects logged expression behavior.
|
Allow runtime scrolling |
|
Checked |
Enables scrolling of runtime lines.
Note: If a line shares an axis with a line type that has been blocked from scrolling, the line will not scroll. |
|
Clear |
Prevents line scrolling. |
Allow runtime scrolling, combined with JumpToCurrentTime, affects logged expression behavior.
|
|
A Wait State configuration example. |
|
|
Details about wait state methods. |
|
|
Step 7. Configure Chart Properties. |