SetLineDisplay is a method for a Trend Invoke method action.
|
Purpose: SetLineDisplay |
|
|
Advanced Configuration: SetLineDisplay |
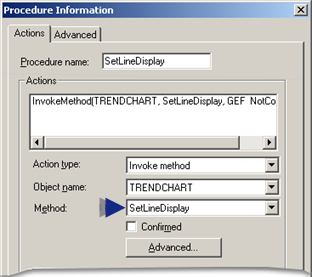
Purpose: SetLineDisplay
To set the color, compression and expansion, and display method for a particular Line ID.
Advanced Configuration: SetLineDisplay
Click Advanced on the Action tab of the Procedure Information dialog box.
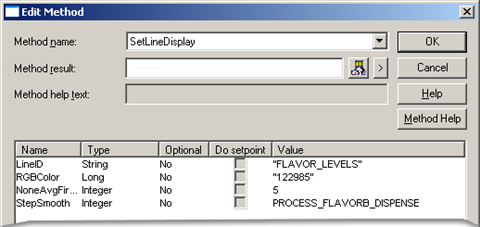
The Edit Method dialog box opens for the SetLineDisplay method
Configuration is as follows.
|
Field |
Description |
|||||
|
Method name |
Name of the selected method. Note: Another method can be selected from the drop-down list. |
|||||
|
Method result |
(Optional) Setpoint that contains the status value. |
|||||
|
|
Class |
Boolean |
||||
|
|
Structure Type |
BOOL |
||||
|
|
Allowed |
Device or global Point ID. |
||||
|
|
When a user invokes the method, the method result contains one of the following values. |
|||||
|
|
|
|
Value |
Method Result |
||
|
|
|
|
1 |
The change was successfully made. |
||
|
|
|
|
0 |
The change was not made. |
||
|
Parameters |
LineID |
String that identifies the line ID whose display parameters you want to change. |
||||
|
|
Type |
An RGBColor value from either the Standard RGBColor Values Table or calculate your own. |
||||
|
|
NoneAvgFirstLastMinMax |
Expression or point ID for that evaluates to one of the following numeric values: |
||||
|
|
|
Value |
Trending will: |
|||
|
|
|
0 |
Not do any compression. |
|||
|
|
|
1 |
Plot the average of the values in the group. |
|||
|
|
|
2 |
Plot the first data point in the group. |
|||
|
|
|
3 |
Plot the last data point in the group. |
|||
|
|
|
4 |
Plot the data point from the group with the smallest value. |
|||
|
|
|
5 |
Plot the data point from the group with the largest value. If you are using compression, Trending automatically determines the group size. |
|||
|
|
|
6 |
Plot the average of the values in the group, using server side compression. |
|||
|
|
|
7 |
Plot the first data point in the group, using server side compression. |
|||
|
|
|
8 |
Plot the last data point in the group, using server side compression. |
|||
|
|
|
9 |
Plot the data point from the group with the smallest value, using server side compression. |
|||
|
|
|
10 |
Plot the data point from the group with the largest value, using server side compression. |
|||
|
|
|
Note: If you enter an option from 6 through 10, the NoneAvgFirstLastMinMax field performs the same as the Type field in SetLineCompression. Specify the time interval to collect the historical group size either in a SetLineCompression method or in the Trend control's Line Display dialog box. |
||||
|
|
StepSmooth |
Expression or Point ID that evaluates to one of the following numeric values. |
||||
|
|
|
|
Value |
Trending will |
||
|
|
|
|
0 |
Display the line in step mode. |
||
|
|
|
|
1 |
Display the line in smooth mode. |
||
|
|
|
|
|
|
|
|
|
|
RGB Color values. |
|
|
List of line display methods. |
|
|
All Trend methods. |