You use the Process Analyst Properties dialog box
to configure the axis of the selected pen. A pen axis can be
configured at run time by Operators, and at design time by
Users.
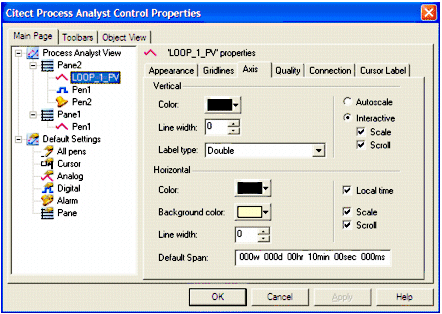
You can configure the color, line width, label
type, scroll and scale properties for the date/time and value axes.
You can also choose whether to display time on the date/time axis
using local or UTC format.
Note: To configure defaults for pen axes,
select the All pens item in the property tree
under Default Settings, and then complete the
procedure below.
To configure a pen axis:
Click the Main
Page tab.
From the property tree list,
select the pen you want to configure axes for.
Click the Axis tab to display the axis property controls.
In the Vertical area, select a Color by
using the color swatch.
Enter a new Line
width.
Select a Label type. This specifies the format to use for axis
values.
Do one of the following (analog
pens only):
Select the Autoscale option to autoscale the vertical axis.
Select the Interactive option, and then select Scale to be able to interactively scale the vertical
axis; and/or select Scroll to be able to
scroll the axis.
Note: These options are also
available on the right-click (context) menu.
In the Horizontal area, select a Color by
using the color swatch.
Select a Background color by using the color swatch.
Enter a new Line width.
Enter a Default
Span to define the span you want to use for a new pen.
The default span is used by the Process
Analyst when the Operator or User clicks the Reset
to Default Span button, or if the pen is added in pen unlocked
mode, or if the pen is the first one added to a display.
If you're setting the span value as
a default setting for new pens, the new span value is inherited by
news pens created.
Select the Local Time option to display the date/time axis in
local time using your machine settings. If this option is not
selected, the time is displayed in UTC format. For details about
time display on the date/time axis, see Date/Time (Horizontal)
Axis.
Select Scale to be able to interactively scale the vertical
axis.
Select Scroll to be able to scroll the axis.
Note: The Scale and Scroll options are also
available on the right-click (context) menu.