The vertical (value) axis is located at the left-hand edge of the pane.
Like the date/time axis, the value axis consists of major and minor intervals, but they represent value intervals rather than date and time. The intervals are calculated automatically by the Process Analyst.
The value axis is shown only for analog pens; the axis displayed reflects the values for the primary selected pen.
By default the vertical axis will use the engineering scale from the tag of the selected pen. The vertical axis also supports autoscaling. When autoscaling is enabled, the vertical axis automatically adjusts its limits to accommodate new samples as they are added to each individual pen.
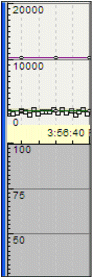
In this example, there are two panes, each of which has a differently scaled vertical axis.
You can scroll and scale the vertical axis; for details, see Scrolling the Chart and Scaling the Chart. You can also configure the appearance of the vertical axis; for details, see Configuring pen axes.