Data compaction is the visual representation of multiple data points that are not distinguishable due to their rate of occurrence across the currently selected time span.
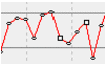
Data is compacted by grouping raw samples together and visually representing them as one sample. Sample compaction is indicated on the graph by using different sample markers. For example, in the illustration below, the two sample markers that appear as squares actually represent multiple raw samples.
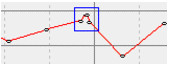
The following illustration zooms in on the second multiple sample. It shows that what appeared to be a single sample actually consists of several raw samples:
The Process Analyst uses the following default point styles for single and multiple samples:
|
Sample compaction |
Point type |
|---|---|
|
Single |
|
|
Multiple |
|
|
Interpolated |
|
See also