This shows a centralized database for all Analog Tags for all SCADA Nodes in the project with Data Log to ODBC enabled.
The individual tags must have both Data Log DB enabled and Log to ODBC Frequency must be greater than zero.
These can be sorted and filtered by Time, Date, and node addresses. An HTML report is displayed which can be copied and pasted into EXCEL, WORD and other office applications preserving the cell, column and other formatting.
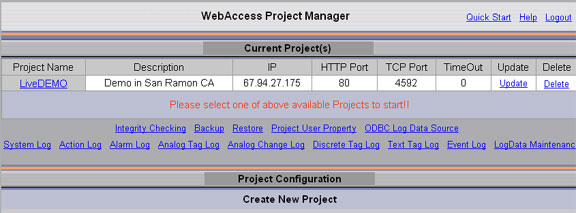
From the Project Manager, Project Users can see the Analog Tag Log from the 'Project Home' page.
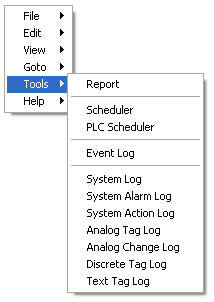
Power Users can also see this Log
from VIEW using the Tools menu:
Right Click -> Tools -> Analog Tag Log.
All Users can also see this Log from
ViewDAQ using the menu
bar:
Tools -> Analog Tag Log.
The Analog Tag Log contains values of all tags on all Project and All SCADA nodes that have log to ODBC enabled for the SCADA node and the tags.
It can be sorted and filtered by Project, SCADA Node, Date, and Tag name.
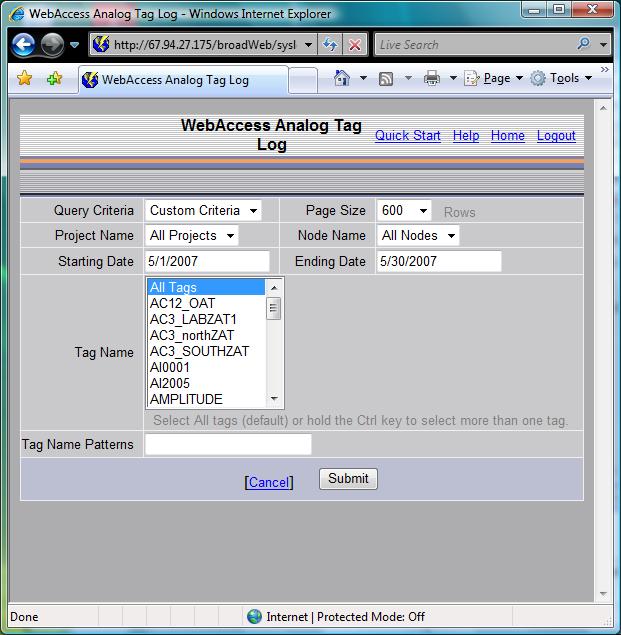
Use the CTRL key to select multiple project names, nodes or tag names.
Use SHIFT key to select a range of project names, nodes or tag names.
An optional Tag Name Patterns field isto let users search for patterns using wildcard characters when “All Tags” is highlighted. The wildcard characters are database dependent (.e.g Access, SQL Server, Oracle, MySQL) used to store ODBC data. For an Access database, use % (percent symbol) to match any number of characters and _ (underscore) to match any single character.
An HTML report is displayed .
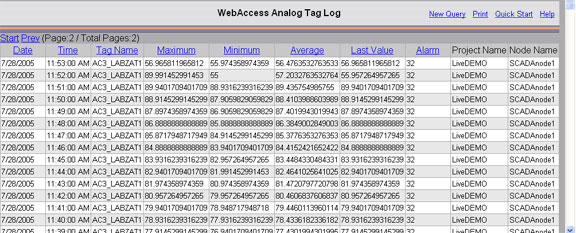
The HTML report displayed can be copied and pasted into EXCEL, WORD and other office applications preserving the cell, column and other formatting.
Data can be exported to EXCEL (VIEW and ViewDAQ to EXCEL 2000 or later, the Project Manager requires EXCEL 2002 or later). See 21.3.2 Export to EXCEL from ODBC Log
The reporting period is always one minute.
The number of samples in the reporting period is fixed at one minute. This is the same as the record interval in the bwAnalogTable in the ODBC database (default is bwPDATA.mdb). The number of samples used to make up a record (a one-minute value) is determined by the Tag's configuration of Log to ODBC Frequency. The Maximum, Minimum and Average values are based on how many samples at the Log to ODBC Frequency fit into one minute. If log to ODBC is 1 seconds, then there are 60 samples. If log to ODBC is one minute, then there is one sample. If communications fails or is very slow, there maybe fewer samples (i.e. if communications can not keep up with the Log to ODBC Frequency, then there may be fewer than the requested samples).
The default number of records per page for log displays is to 600.
The display used is bwanalog.uti.
BwAnalogTable : Data log for Analog tag
a. ProjNodeId : Unique ID for a SCADA node.
b. TagName : Tag Name.
c. LogDate : Date of the record was recorded.
d. LogTime : Time of the record was recorded.
e. MaxValue: Maximum value of the recording period.
f. AvgValue: Average value of the recording period.
g. MinValue: Minimum value of the recording period.
h. LastValue: The Maximum value of the recording period.
i. Alarm: If the tag is in alarm during the recording period.
-2147483648 (Decimal) or 0x80000000 (HEX) means there is no data during the minute of collection. Otherwise, the value of this field is a LOGICAL OR of all the Alarms that occurred during the interval.
Alarm Code Alarm Code
Description
Decimal
Hex
-2147483648 0x80000000 no data during the minute of collection.
2 0x02 Acknowledged Alarm
4 0x04 High High Alarm
8 0x08 High Alarm
16 0x10 Low Alarm
32 0x20 Low Low Alarm
64 0x40 Rate of change Alarm
128 0x80 High Deviation Alarm
256 0x100 Low Deviation Alarm