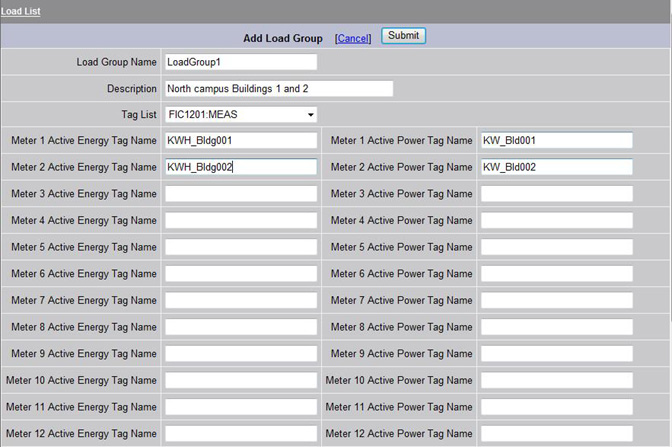
To configure Demand Control, you define a Load Group, the meters used to measure the power consumption then define the loads associated with the Load Group. A load group can have hundreds of loads associated with it. Typically it has only one kilo-watt hour meter, but a dozen of meters can be defined. The Demand Control expects the meter to be in KiloWatt-hours. Kilo-Watt meter input is also used by the algorithm.
Active Energy Tag Name is a Kilowatt Hour meter (KWH).
Active Power Tag Name is a Kilowatt meter (KW).
If only a kilowatt meter is available, an Accumulation Tag in WebAccess could be used to generate the KiloWatt-hours. Calculation Tags can also be used to convert Watts or Watt-hours to KiloWatts and Kilowatt-hours
Figure 24.3.1.1 - Kilowatt-Hour (KWH) meters and Kilowatt (KW) meters defined for measuring power usage
2. In the Tarrif Section define a Beginning and End for Summer in the format Month/Day.
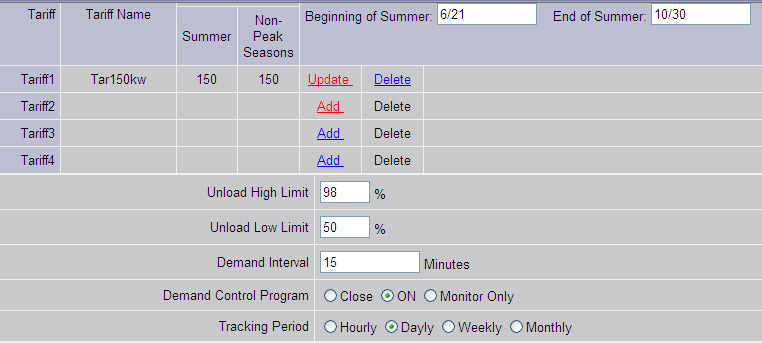
Figure 24.3.1.1.2 - Tariffs and Loads
In Tariff1 row, select Add. The Add Tariff page opens.

Tariffs are a way to specify a different Demand Target based on Day of Week and Date. Currently Peak, Off Peak and Half-Peak Saturday are supported (essentially 3 tariffs and 6 Demand Targets).
Note there is room to specify 4 but in the current version of WebAccess there is no way to specfy a fourth.
These are demand based on the Day of the Week. Each Tariff has its own peak demand target level. Only one Tariff is active at any one time. This allows the Demand Control to take into account multiple tariffs provided by some utility companies (for example, cheaper power on weekends).
If Off-Peak is selcted, a Calender opens to allow specifying which days are Off-Peak. A radio button alllows all Sundays to be selected. This is good for a year in the future.
Define and Unload High Control Limit as a percent of the Demand Target. The High Control Limit is the actual not to exceed limit of the algorithm. Making it less than the Demand Target allows for unexpected surges in Power.
Define a Unload Low Control Limit are specified as a percent of the Demand Target. The Demand Control takes no action until Current demand exceeds the Low Control Limit.
The algorithm runs 1 per minute. Once the once the current demand exceeds the low control limit, the algorithm calculates a worse case scenario and sheds loads to avoid exceeding demand limit. If loads increase rapidly, then the Unload Load Limit should be decreased to allow time for the Algorithm to react. Making the Unload Low Limit to big results in unecessary shedding.
Define the Demand Interval. Demand Control shaves off demand peaks in the facilities demand profile for a sliding window. The sliding window (typically 15 minutes in most energy contracts) can be defined by the user. This is a continuously moving window of the last 15 minutes (or whatever is defined by the user). The previous window is also displayed.
This defines a Moving Window (also called a Sliding Window or Period) is used to calculate power usage continuously. The interval of this moving window can be specified, 15 minutes and 1 hour being commonly used. If 15 minutes, the algorithm works to ensure demand is less than Target Demand over the last 15 minutes at any 15-minute window in time (hence, the moving window analogy). The current moving window's KWH (Consumption) and KW (Demand) are shown in Red and labelled CP (Current Period). The Previous moving window's KWH and KW are shown in White in the Load Group Display.
Define the mode of the Control Algorithm
when the SCADA Node starts.
ON means the Control Algorithm start immediately.
Close means it is OFF until an operator goes the the Laod
Control Group Display and presses ON.
Monitor Only is that the algorithm calculates and displays
its estimate in the Load Control Group Display, but does not
shed load.
It is recommended to balance and shed loads manually before turning on Load Control if Demand is significantly above Target to avoid aggressive shedding by the algorithm on start up.
Tracking Period is for Display purposes only and Displays the KWH for the Tracking Period. Hourly is the KWH resets to 0 on the Hour. Daily, the KWH reset at midnight, etc. This is displayed at the bottom left of the Load Group Display.

Loads are the physical equipment that the Demand Control turns off (for example, lights, fans, motors, and air conditioners.)
The loads are shed in order of priority. Low priority loads are shed first, higher priority loads later. (There are 6 priorities with priority 1 being the first to be shed).
In Load Shed Priority 1, select Add Load. the Add Load page opens.
Repeat Add Load to add additional Priority 1 loads.
Repeat Add Load to add loads of other priorities.