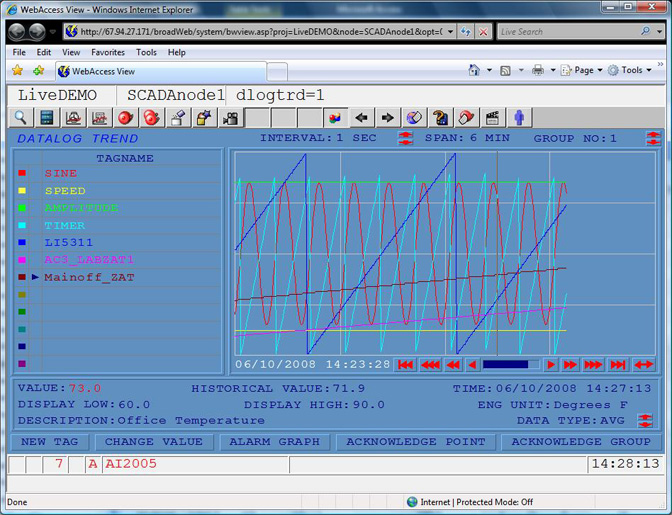
DATA log Trends use a single Template Display that is pre-built and supplied with WebAccess. There is no graphics building required. Up to 12 Tags can be viewed on a single Data Log Trend Display. There is no limit to he number of DataLog Trend Groups.
Figure 6-1Data Log Trend Display (real-time & historical trend)
Pick a spot on the Trend area. A crosshair line appears. The value of the tag (historical Value) and Time of that value appears.
![]()
Figure 6-2Data Log Trend Interval: Seconds, Minutes, Hours, and Days
Use the UP/Down arrow keys next to Interval to change from Seconds, Minutes, Hour, and Day.
The Interval will allow variable sample rates for display of Data Log trends in VIEW and ViewDAQ. This modifies the 'effective sample rate for the run-time display only. The Data is still collected based on the Deadband and other properties configured for the Tag and SCADA node.
DataLog Trend Display supports the following time spans for viewing data: 6 min, 12 min, 30 min, 1 hour, 2 hour, 4 hour, 6 hour, 12 hour, 18 hour, 24 hour, 2 day, 4 day, 1 week, 1/2 month, 1 month, 2 months, 3 months, 4 months, 6 months, 1 year, 2 years, 3 years, 4 years, and 5 years.
This feature allows the viewing of data at a sample frequency different than the recording frequency. The intent is to allow users to adjust the time span across the screen.
The field for Data Log Trend configuration is Time Span; the default value is 6 minutes.
Use the Double Arrow button ![]() to open a Calendar Dialog
Box to jump to a date.
to open a Calendar Dialog
Box to jump to a date.
Use the scroll buttons to scroll forward or back in time.
![]()
Using the Data Type scroll ![]() Users can change the data type
displayed for each tag Trends can display Average,
Maximum, Minimum or Last value for the Minute, Hour and Day
intervals.
Users can change the data type
displayed for each tag Trends can display Average,
Maximum, Minimum or Last value for the Minute, Hour and Day
intervals.
Users can change the Display High and Display Low to "zoom in" or "zoom out" of trend data. By default, WebAccess uses the High Span and Low Span of the Tag. DataLog Trend Displays have configurable Display High and Display Low values for the y-axis (and x-axis in X-Y Plots). Trend displays will “remember” changes made to Display High and Low from VIEW and ViewDAQ. The Display High and Low are assigned to the Trend Group, allowing the same tag to have different sets of Display High and Low when assigned to multiple display groups.
1. Select a Tagname by clicking on the colored square.
2. Click Display Low
3.
A Change Dialog Box opens
4. Type a new number for Display Low or use the ramp keys or slider.
5. Click Enter.
6. Repeat for Display High.
If you leave this Data Log Trend Group, the default Display Low and Display High will be used.
1. Select an field under Tagname by clicking on a colored square.
2. Click New Tag
3. A Dialog Box of Tags with Data Log enabled. Both the tagname and Description are listed.
4. Select Tag Name.
If you leave this Data Log Trend Group, the Tag will disappear from the List.
If you select a field that already has a Tagname, the New Tag will temporarily replace that Tag until you leave, then return to this Data Log Trend Group.
To permanently add a Tag to a Data Log Trend Group, use the Configuration Manager to Modify the Trend Group.
To change a Tag from LAST to MAX, you have to pick the tag from the left menu, then use the UP/down arrows at the bottom right to change to AVG or MAX or Min or LAST. This does one tag at a time so you can compare MAX of one tag to MIN of another. Also AVG, MAX, MIN only applies for time frames of 1 minute or 1 hour.
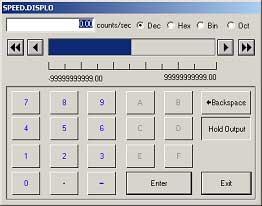
The Change Value pushbutton at the bottom of Data Log Trend allows you to Change the Value of a Tag from the Trend Display.
1. Click a Tagname from the Trend
2. Click Change Value
3. The Change Value Dialog Box Opens.
If the user does not have the Area and Level Security required by the tag, a Login Dialog Box opens.
The Alarm Graph allows an operator to go directly to the Alarm Graphic assigned to the selected tag. The Tag must be in the unacknowledged alarm state and an Alarm Graphic must be configured for the tag.
The Acknowledge Point Pushbutton acknowledges the Alarm for a selected Tag
Acknowledge Group Pushbutton acknowledges all alarms for all Tags in this Trend Group.
To export data in an HTML format that can be copied and pasted into EXCEL, emails and Word and other programs
From the Tools item ( Right Click in Web Browser or from Menu Bar in Local View) select Export Data.

Figure 6-1bData Log Trend Display Customized (real-time & historical trend)
Users can create use multiple trend templates (e.g. different colors and layouts) in the same project. For example some trend groups can have black backgrounds to facilitate viewing while others have white to facilitate printing on paper. Users can create and assign up to 100 extra customized trend graph templates for Realtime/Datalog Trend groups. These custom trends displays are then assigned in the Trend Group.The customized trend graph templates must have “b??” as the file extension:
For Datalog Trend, the file must be in the form of dlogtrd.b00, dlogtrd.b01, ..., or dlogtrd.b99.
For Datalog Xyplot, the file must be in the form of dlogxyp.b00, dlogxyp.b01, ..., or dlogxyp.b99.