This section assumes:
· You have already created the BLOCKS and TAGS you plan to add to your Data Log Trend Group Displays. You can type in the Tag Names and Block Names of tags and blocks you plan to build.
· You have to enabled DATA LOGGING for each TAG using Log Data in Tag Properties (see Analog Tag Properties or Discrete Tag Properties).
This section assumes you have started Internet Explorer Web Browser and connected to your Project Node.
1. Start WebAccess Configuration.
2. Login with User Name and Password.
3. Select your Project Name.
4. Select the SCADA Node.
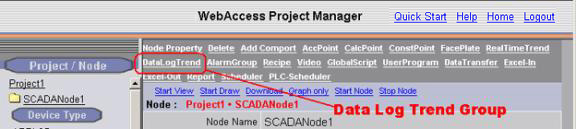
5. Select DataLog Trend.
Figure 6.6 Data Log Trend in Project Manager
The Data Log List Page appears.
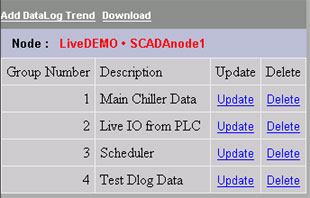
Figure 6.7 DataLog Trend Display Group List
6. Select Update of the Group you want to modify.
7. The Update Data Log Trend Group Opens (Figure 6.5).
8. Select the field next to Tag Name you are to modify (Tag Name 1, Tag Name 2, etc.).
9. Open the Pull down list by clicking on Tag List (Figure 6.5). This shows the names of all Analog Tags with Log Data and Discrete Tags with Log Data set to yes.
10. Scroll down the Tag List. Click the Tagname desired. The Tagname should appear on the Tag Name field.
11. Repeat for the Tag Name fields (1 to 12).
12. If you did not enabled Data Log for a tag, you can enable data Log later and enter the tag name now. You can Type Tag names and Blocks (BLOCK:PARAMETERs). You can also copy and paste Tag Names and Block Names from the Left Frame of your browser.
13. Select the opening Plot Type that will appear for each tag.
Users can change this from VIEW in combination with the Time Period Chosen (Seconds, Minutes Hours, and Days)
· LAST shows the last recorded value of the Tag during the time period.
· Average shows the average value.
· Minimum will show the smallest value.
· Maximum will show the largest value.
If seconds are the time period chosen by the user, the Last value is always shown. Seconds is the default period chosen. You entry here will affect the Minutes, Hours and Day time periods.
14. The Display High and Display Low to "zoom in" or "zoom out" of trend data. By default, WebAccess uses the High Span and Low Span of the Tag. DataLog Trend Displays have configurable Display High and Display Low values for the y-axis (and x-axis in X-Y Plots). Trend displays will “remember” changes made to Display High and Low from VIEW and ViewDAQ. The Display High and Low are assigned to the Trend Group, allowing the same tag to have different sets of Display High and Low when assigned to multiple display groups.
15. Press Submit when finished making changes to your Data Log Trend Group.
16. There are two ways to download these changes to the SCADA Node:
16a. Download to the SCADA node from the SCADA Node properties page. If you have never downloaded the SCADA node before, then this is required. This will temporarily stop the SCADA node (if it is running).
OR
16b. Use the Download hyperlink on the Data Log Trend Display Group List Page (figure 6.7 above). This will download changes to the Data Log Trends without stopping the SCADA node.
Users can add tags, change time span and change Display High and Display Low from VIEW and ViewDAQ in Data Log Trends. These changes can be saved to the Project Node from the Edit Menu using Save Trend Setting.