 At least one
RealTime Trend Group must be configured. You can add tags to this
group or change them. Any Tag can be added to a Trend Group in VIEW
(i.e. by operators and ordinary users in run-time).
At least one
RealTime Trend Group must be configured. You can add tags to this
group or change them. Any Tag can be added to a Trend Group in VIEW
(i.e. by operators and ordinary users in run-time).Real-time Trends. These are intended as temporary trend files. The Data in a Real-time trend lasts only long enough to fill the trend screen. Real-time Trends are ideal for Tuning of PID loops, where short term data is needed only long enough to tune the Loop.
The time span is not adjustable in VIEW. The Time Interval is fixed when the engineer builds the real time trend in Project Manager. The time is a function of the time interval and number of samples.
Sample
Rate for Realtime Trends range from 1 to 180 seconds.
The Number of Samples in a Real Time Trend ranges from 60 to
480 samples. For example, using a 1 second interval and 480 samples
= 1 x 480 = 480 seconds. If using a 180 second interval and
480 samples = 180 x 480 = 86400 seconds
At least one
RealTime Trend Group must be configured. You can add tags to this
group or change them. Any Tag can be added to a Trend Group in VIEW
(i.e. by operators and ordinary users in run-time).
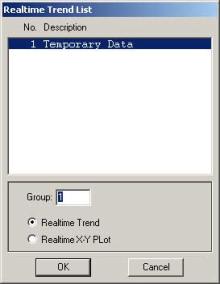
The Realtime trend icon ![]() on the toolbar will open the
RealTime Trend Pop-up Dialog Box. The F3 key or
<F3> keymacro will also open the RealTime Trend
List.
on the toolbar will open the
RealTime Trend Pop-up Dialog Box. The F3 key or
<F3> keymacro will also open the RealTime Trend
List.
Realtime Trends are plotted versus Time (the X-axis is Time). Similar to a strip-chart recorder.
Realtime X-Y Plots are plotted versus a selected Tag. Any of the twelve tags can be selected as the X-axis, the other 11 tags are plotted on the Y-axis. RealTime Plots are commonly used to show a relationship between two tags)
The groups provide a fast an efficient way to specific a large number of pre-built Display Trends with names that are meaningful to operators and ordinary users.
Realtime Trends use a single Template Display that is pre-built and supplied with WebAccess. There is no graphics building required. Up to 12 Tags can be viewed on a single RealTime Trend Display. There is no limit to the number of Realtime Trend Groups you can configure.
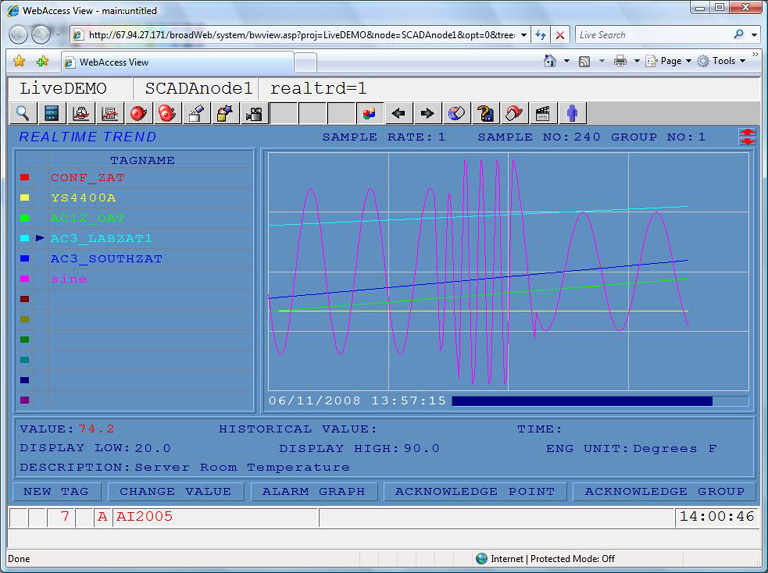
Figure 6-8 RealTime Trend Display
By default, WebAccess uses the High Span and Low Span of the Tag. Users can change the Display High and Low Span to "zoom in" or "zoom out" of trend data.
1. Select a Tagname by clicking on the colored square.
2. Click Display Low
3.
A Change Dialog Box opens
4. Type a new number for Display Low or use the ramp keys or slider.
5. Click Enter.
6. Repeat for Display High.
If you leave this RealTime Trend Group, the default Display Low and Display High will be used.
1. Select an field under Tagname by clicking on a colored square.
2. Click New Tag.
3. A Dialog Box of Tags all tags in the system opens. Both the Tagname and Description are shown.
4. Select Tag Name.
If you leave this RealTime Trend Group, the Tag will disappear from the Trend.
If you select a field that already has a Tagname, the New Tag will temporarily replace that Tag until you leave, then return to this Trend Group.
To permanently add a Tag to a Realtime Trend Group, use the Configuration Manager to Modify the Trend Group.
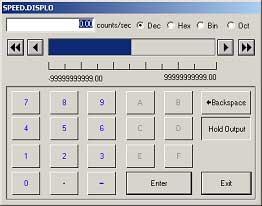
The Change Value pushbutton at the bottom of Trend allows you to Change the Value of a Tag from the Trend Display.
1. Click a Tagname from the Trend
2. Click Change Value
3. The Change Value Dialog Box Opens.
If the user does not have the Area and Level Security required by the tag, a Login Dialog Box opens.
The Alarm Graph allows an operator to go directly to the Alarm Graphic assigned to the selected tag. The Tag must be in the unacknowledged alarm state and an Alarm Graphic must be configured for the tag.
The Acknowledge Point Pushbutton acknowledges the Alarm for a selected Tag
Acknowledge Group Pushbutton acknowledges all alarms for all Tags in this Trend Group.
Users can create use multiple trend templates (e.g. different colors and layouts) in the same project. For example some trend groups can have black backgrounds to facilitate viewing while others have white to facilitate printing on paper. Users can create and assign up to 100 extra customized trend graph templates for Realtime/Datalog Trend groups. The customized trend graph templates must have “b??” as the file extension:
For Realtime Trend, the filename must be in the form of realtrd.b00, realtrd.b01, ..., or realtrd.b99.
For Realtime Xyplot, the filename must be in the form of realxyp.b00, realxyp.b01, ..., or realxyp.b99.