This dialog allows you to configure the style of the pen used to draw the data Point values on the object during runtime.
Accessing the dialog
To access the Pen Style dialog for a specific data point, first access the Points dialog and then click the Style column for that data point.
Also, it can be launched during runtime, allowing the user to customize these settings on-the-fly.
The dialog in detail
Figure 1.
Pen Style dialog
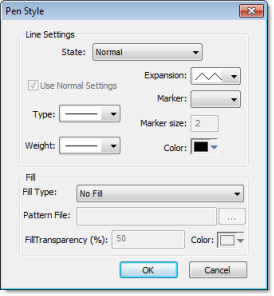
The Pen Style
dialog includes the following elements:
| Area / Element Name | Description | |
|---|---|---|
| Line Settings | State | You have the option of defining a Hi Limit and a Lo Limit for each data Point, with the Options dialog. The Pen Style Dialog allows you to configure different settings for the pen (e.g., color), both when its values are within the limits (Normal State) and not within the limits (Out of Limits state). |
| Use Normal Settings | Available only for the Out of Limits state. When checked, the pen will always be displayed with the settings for the Normal state, even if the data point values are not within the limits configured for it. | |
| Type | The type of line (e.g., solid, dashed, dotted) that connects the data points. | |
| Weight | The weight of the line that connects the data points. | |
| Expansion | The algorithm used to connect the points, as follows:
|
|
| Marker | The shape used to mark each data point. If no shape is selected, then only the connecting line between points is displayed. | |
| Marker size | The size of the data point marker. | |
| Color | The color of the trend line and data point markers. | |
| Fill | Fill Type | The type of fill between the trend line and the number line. |
| Pattern File | The graphic file used to fill the trend area.
Available only Fill Type is set to Custom Pattern.
Click the browse button to open a Windows file browser and then select the desired graphics file. The file should be located in your project folder. See below for an example of trends with custom fill patterns. |
|
| Color | The color used to fill the trend area. Available only when Fill Type is set to Solid Color. | |
| Fill Transparency (%) | The transparency level of the fill. (If the fill is transparent, then other trends behind it can be seen through it, making the entire graph easier to read.) Available for both Custom Pattern and Solid Color. | |
Note: When
viewing your project on either a Windows Embedded device or a Thin
Client (any OS), the Pen Style dialog — available during runtime —
allows the user to change the pen color only.
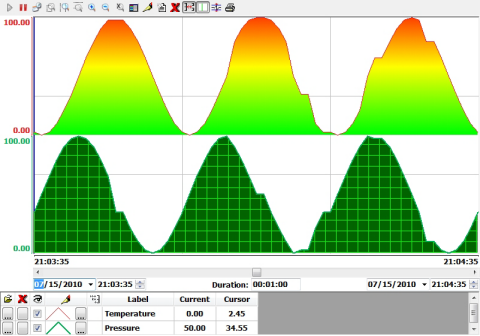
Figure 2. Trends with
custom fill patterns