At least one DATALOG Trend Group must be configured to view Data Log values for all your Tags. Operators and users can add tags to this group or replace them "on-the-fly" in VIEW without loosing data.
The groups provide a fast an efficient way to specific a large number of pre-built Display Trends with names that are meaningful to operators and ordinary users.
To open the Data Log Trend Pop-up Dialog Box with a list of all these Data Log Trend Groups.
Select the
Standard Toolbar
button ![]()
Or Press the F4 key on the keyboard
Or Right Click -> Goto -> Data Log Trend (in a web browser VIEW)
Or on the ViewDAQ menubar, select Goto -> Data Log Trend
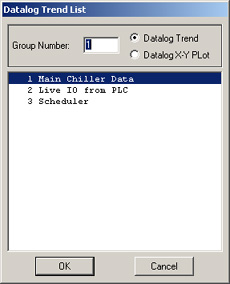
Figure 5.12 - Data Log Trend List Box
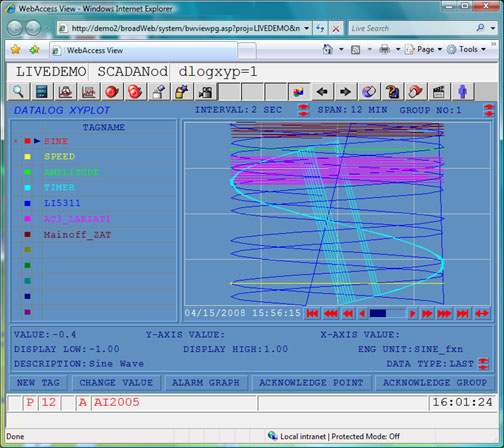
Datalog Trends are plotted versus Time (the X-axis is Time), similar to a strip-chart recorder. (Figure 5.13)

Datalog X-Y Plots are plotted versus a selected Tag. (Figure 5.14) Any of the twelve tags can be selected as the X-axis; the other 11 tags are plotted on the Y-axis. Data Log Plots are commonly used to show a relationship between two tags).