Moving Range chart properties | Configuring a Moving Range chart | Moving Range chart calculations
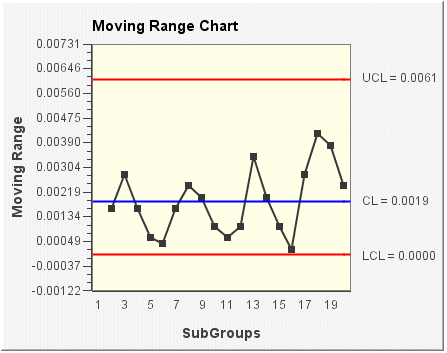
The Moving Range chart is a variable chart that shows both the individual and moving range for a subgroup of 1. This type of chart is appropriate for long production runs where 100 percent inspection is being used. The Moving Range chart shows variability between one data point and the next.
In the following Moving Range chart example, each plotted point represents the difference between consecutive subgroup values. The center line represents the average of all subgroup ranges.
