P chart properties | Configuring a P chart | P chart calculations
The P chart is an attribute control chart that shows the proportion of nonconforming units from samples of varying/constant size. Proportion is defined as the ratio of nonconforming items in a population to the total number of items in a population. The process attribute is described as one of two possible outcomes, for example, pass/fail, yes/no, and so forth.
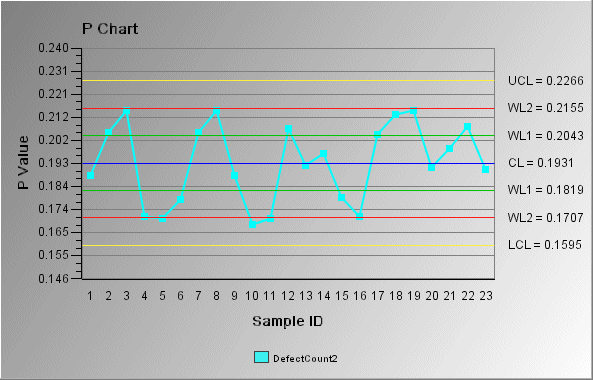
In the following P chart example, the x-axis shows the percentage of nonconforming items for each sample. In this case, the constant sample size is set by the data source. The control limits (shown on the chart as UCL, CL, LCL, WL1, and WL2) are also set according to the data and a sigma limit of 3.
