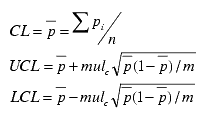
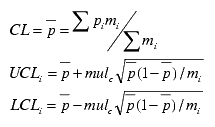
P chart control limits are calculated as follows:
|
|
Control Limits
calculated from |
Control Limits calculated from |
|
Uniform sample size |

|

|
|
Variable sample size |

|

|
Lower Control Limit (LCL)
Upper Control Limit (UCL)
Center Line (CL)