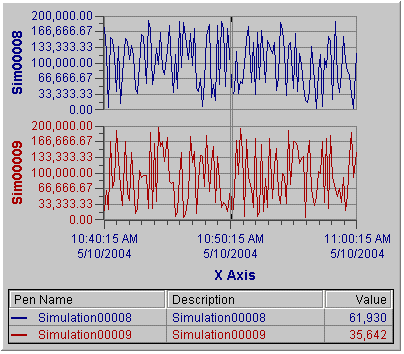
When displaying multiple y axis pens on Time, Event, XY, and Correlation charts, you can stack two or more plotting areas on top of each other for comparison purposes. The following figure shows two stacked plotted areas on a Time chart:

To stack the y axes during run-time, right-click the chart and select Stack Y-Axes from the context menu. When this feature is turned on, a check mark appears beside the option in the context menu. To turn the option off, right-click the chart and select Stack Y-Axes again. The Stack Y-Axes option can also be activated from the chart's configuration panel (in Configure mode).