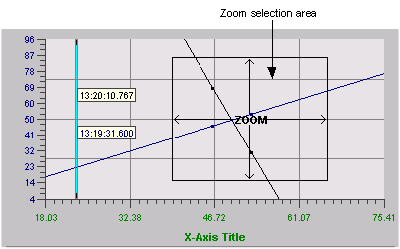
Depending on the amount of data initially shown on a Time, Event, XY, or Correlation chart, you may not be able to see the fine details in a trend. To show more detail, you can zoom in on any area of a chart by placing the mouse pointer in a chart's plotting area, and then clicking and dragging the mouse to select the area you want to enlarge. As you drag the mouse, a selection area appears, as the following figure shows:

When you release the mouse, the selected area is enlarged.
You can also zoom in and out via the chart's context menu.
NOTE: The Auto Refresh option negates all zooms. Consequently, if you need to zoom into a chart, you may want to lengthen the Auto Refresh interval or disable the option temporarily.
Position the mouse pointer over the plotting area of the chart.
Right-click and select one of the following zoom commands from the context menu:
Select Zoom from the context menu to zoom the chart horizontally and vertically.
Select Zoom Vertically from the context menu to zoom the chart vertically.
Select Zoom Horizontally from the context menu to zoom the chart horizontally.
You can also zoom a chart by clicking and dragging the mouse inside the plotting area of the chart.
Position the mouse pointer over the plotting area of the chart.
Right-click and select Undo Last Zoom to cancel the last zoom command. To undo all zoom commands, select Undo All Zooms from the context menu.