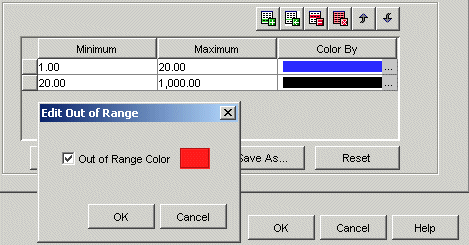
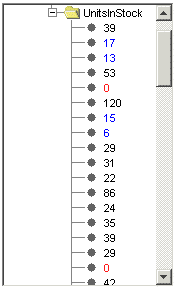
You can configure the tree to display data in different colors based on ranges of values or specific values. A threshold table allows you to set the ranges/specific values and the colors the data will appear in. Using thresholds, you can easily provide users with visual cues about the data. In the following example, thresholds are set for stock levels.
The purpose of setting thresholds in this case is to alert the user when a stock level is getting low. The 1 - 20 range is considered low and any values in this range appear blue. The 20 - 1000 range is considered acceptable and any values in this range appear black. Additionally, an out of range value is set (using the Out of Range button). Since 0 is out of the defined range, it will always appear red, thus alerting the user that additional stock must be ordered.


Threshold values do not need to be numeric; they can be string values, too. For example, you could define red with the threshold string of FAIL and green with the string PASS.
NOTE: Thresholds for a grid within a tree must be set through the Grid's configuration panel (accessed from the Configuration button on the Edit Tree Properties) dialog box. You cannot use the Threshold tab on the Edit Tree Properties dialog box to set thresholds on a tree grid.