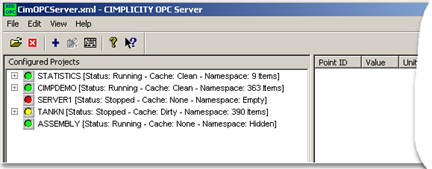
The tree view contains the projects the OPC Server is configured to access. All configured projects appear as top-level nodes with a plus (+) sign and an icon to indicate the status of the project (i.e. Running or Stopped).
There is a “parent” node for each configured project.
Project state is indicated by the following icons:
|
Icon |
Description |
|
|
Green is a running project.
When the points are expanded, the final leaf nodes are the attributes selected in the Select Attributes Shown to OPC Browsers dialog box. Any of the entities in the Tree View (left pane) can be dragged and dropped onto the List View (right pane). Running projects that are shown can be expanded to display their points and point attributes.
|
|
|
Yellow can be one of the following. This project is:
In other words, a cached namespace is available, but it is dirty, possibly does not match the project configuration. |
|
|
Red indicates that the project is not running and there was no cache available for this project. For example, a newly configured project that is not running when it is connected to the OPC Server will display red until it is started. Name space is empty. Projects that are not running are considered off line and cannot be expanded. |
If the OPC Server is launched when no associated projects are running,
![]() The tree view shows the configured
projects.
The tree view shows the configured
projects.
![]() The only points available to view
are built-in statistic or diagnostic type items.
The only points available to view
are built-in statistic or diagnostic type items.
![]() Any OPC Client trying to browse
the OPC Server in this case will see only the built-in items'
state, the namespace for this project is empty.
Any OPC Client trying to browse
the OPC Server in this case will see only the built-in items'
state, the namespace for this project is empty.
|
|
2. Attach projects to the OPC Server. |