|
Debug overview |
|
|
Debug options |
Debug Overview
While debugging, you are actually executing the code in a script line by line.
Start the script.
Click the
button ![]() on the Application toolbar.
on the Application toolbar.
The script is ready to be debugged.

|
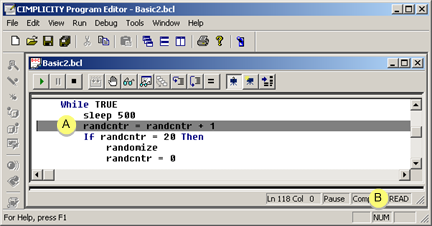
A |
The Program Editor displays an instruction pointer on the line of code that is about to be executed. When the instruction pointer is on a line of code, the text on that line appears in black on a gray background that spans the width of the entire line. |
|
B |
The edit pane is read-only during the debugging process. You are free to move the insertion point throughout the script, select text and copy it to the Clipboard as necessary, set breakpoints, and add and remove watch variables, but you cannot make any changes to the script until you stop running it. |
Debug Options
|
Fabricate event information. |
|
|
Step through scripts. |
|
|
Use breakpoints. |
|
|
Perform traces in scripts. |
|
|
Use a Watch variable. |
|
About the Program Editor. |