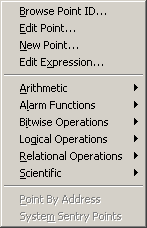
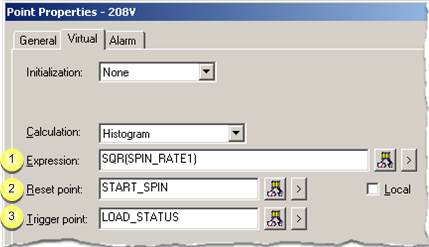
Select Histogram in the Calculation field on the Virtual tab.
A Histogram point records the frequency at which the value of the source point, identified in the Expression field, updates within specified range intervals. This information is typically displayed graphically as a histogram.
Each time the source point is updated, the counter whose range encompasses the source point value is incremented.
You must configure a Histogram point as an array point. The number of elements in the array will be:
the number of range intervals you desire + 6
The extra six elements are used to maintain the:
![]() Minimum of the point values
received
Minimum of the point values
received
![]() Maximum of the point values
received
Maximum of the point values
received
![]() Total number of samples
received
Total number of samples
received
![]() Sum of the values of all samples
received
Sum of the values of all samples
received
![]() Number of sample values that were
less than the lower limit of the point range (underflow bucket)
Number of sample values that were
less than the lower limit of the point range (underflow bucket)
![]() Number of sample
values that were greater than the upper limit of the point range
(overflow bucket)
Number of sample
values that were greater than the upper limit of the point range
(overflow bucket)
|
Expression |
|
|
Reset point |
|
|
Trigger point |
|
|
Example |
|
Expression |
Enter an expression that calculates the value of the Histogram point.
The expression will be monitored for transitions.
The expression may contain:
![]() One or more Point IDs as well
as
One or more Point IDs as well
as
![]() Constant values, operations, and
functions.
Constant values, operations, and
functions.
Buttons to help with the equation are as follows.
|
|
Opens the Expression Editor. |
|
|
|
Displays a Popup menu to: |
|
|
|
|
|
|
Reset point |
Based on whether there is an entry in the Reset Point field, at runtime the Histogram point is reset as follows:
|
When the trigger point is not defined |
||
|
If |
And |
Then |
|
An Initial
Histogram |
The Current value
of the |
Each Array element
of the |
|
Not defined |
Unavailable |
Zero |
|
Not defined |
Available |
Zero |
|
Defined |
Unavailable |
Initial value |
|
Defined |
Available |
Initial value |
|
When the trigger point is defined |
||
|
If |
|
Then |
|
An Initial
Histogram |
|
Each Array element
of the |
|
Not defined |
|
Zero |
|
Defined |
|
Initial value |
Note: Buttons to the right of the Reset Point and Trigger Point fields help with configuration.
|
|
Opens the Select a Point browser to select an available point. |
|
|
|
Displays a Popup menu to: |
|
|
|
|
|
|
Trigger point |
When the value of the Histogram point updates depends on whether or not you defined the trigger point as follows:
|
Trigger point |
The Value of the Histogram is |
|
Defined |
Trigger point is updated. |
|
Not defined |
Source point in the Expression field is updated. |
Buttons to help with the trigger point have the same functionality as the buttons to the right of the Reset Point field.
|
Histogram Point Example |
A point called CYCLE_TIME is expected to have a value between 50 and 100, and you want to track the frequency at which values occur within five intervals.
Create a Histogram point called HIST_CYCLE_TIME with:
|
Display Low |
50 |
|
Display High |
100 |
|
Elements |
11 |
|
Expression |
CYCLE_TIME |
The eleven elements of this point contain the following information, where X is the number of point value samples:
|
Element |
Contents |
|
HIST_CYCLE_TIME[0] |
X<50 (underflow bucket) |
|
HIST_CYCLE_TIME[1] |
60<X³50 |
|
HIST_CYCLE_TIME[2] |
70<X³60 |
|
HIST_CYCLE_TIME[3] |
80<X³70 |
|
HIST_CYCLE_TIME[4] |
90<X³80 |
|
HIST_CYCLE_TIME[5] |
100£X³90 |
|
HIST_CYCLE_TIME[6] |
100<X (overflow bucket) |
|
HIST_CYCLE_TIME[7] |
Number of samples |
|
HIST_CYCLE_TIME[8] |
Sum of all sample values |
|
HIST_CYCLE_TIME[9] |
Minimum of the point values received |
|
HIST_CYCLE_TIME[10] |
Maximum of the point values received |
![]() Tip: Use the Display
Limits fields to specify the lower and upper range values
within which the point values are expected to occur. The range
intervals are automatically calculated based on the Display High and Display
Low limits and the number of Elements you specify.
Tip: Use the Display
Limits fields to specify the lower and upper range values
within which the point values are expected to occur. The range
intervals are automatically calculated based on the Display High and Display
Low limits and the number of Elements you specify.
|
|
Step 3.2. Configure virtual calculations. |