You can choose to display one or two sliders on the Trend Control chart.
When you select two sliders you can:
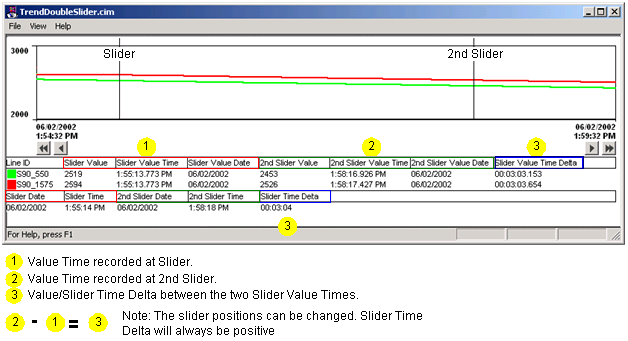
![]() View the point value at the
selected position for each slider as well as the time the value was
recorded (Slider Value Time (and Date)) in the Legend and Status
lines.
View the point value at the
selected position for each slider as well as the time the value was
recorded (Slider Value Time (and Date)) in the Legend and Status
lines.
This enables you to precisely select where you want to compare two values.
![]() View the time period (Slider Value
Time Delta) between the two Slider Value Times, which Trending
calculates for you.
View the time period (Slider Value
Time Delta) between the two Slider Value Times, which Trending
calculates for you.
Time values are shown as follows:
|
In the legend for each line |
Slider Value Time |
Are time stamp values for the last time the point changed to the value at the slider (Thus they are called Slider Value Time, or 2nd Slider Value Time). |
|
|
Slider Value Time Delta |
Is an absolute time difference of these time values for the particular point. |
|
In the status line |
Slider Time |
Are actual slider positions on the time axis (the X-axis). |
|
|
Slider Time Delta |
Is the absolute value of the difference between the two slider times. |
![]() Note: When you open the Trend chart in CimView
Slider 1 is always on top of Slider 2. You can move either slider
to the right or left.
Note: When you open the Trend chart in CimView
Slider 1 is always on top of Slider 2. You can move either slider
to the right or left.
![]() Note: You don't need to keep track of which
slider is slider1 and which slider is slider2. The time and
value differences are always with respect to positive time flow.
And if you are trying to position a slider at a particular
time just look for the Slider time
that is changing when you are dragging whatever slider you happen
to have.
Note: You don't need to keep track of which
slider is slider1 and which slider is slider2. The time and
value differences are always with respect to positive time flow.
And if you are trying to position a slider at a particular
time just look for the Slider time
that is changing when you are dragging whatever slider you happen
to have.
|
|
Step 8. Configure Legend Properties. |