Point lines display a combination of logged and runtime data.
The difference between this line type and the logged expression line is that CIMPLICITY automatically finds the data source for a point line. As a result, data can be quickly accessed wherever the project is running, with no manual data source configuration.
|
How CIMPLICITY finds point data. |
|
|
Configure a point line. |
|
|
Configure array point trend lines |
|
|
Disable point line scrolling. |
How CIMPLICITY finds point data
CIMPLICITY looks for and displays the first data it finds, in the following order:
A CIMPLICITY data table.
The first data table in alphabetical order.
A CIMPLICITY group table.
The first group table in alphabetical order.
If the point is not being logged to either a data or group table, the trend line displays as current data becomes available.
![]() Note: Using a logged expression line is
preferable if you want the data to come from a data source that you
choose, rather than the source chosen by the above order.
Note: Using a logged expression line is
preferable if you want the data to come from a data source that you
choose, rather than the source chosen by the above order.
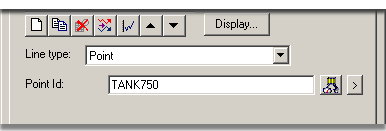
Configure a Point Line
Enter the following.
|
Option |
Description |
|
|
LIne type |
Point |
|
|
Point ID |
Single point ID. Note: You can also enter an ID for an array point or element. |
|
|
|
|
Opens the Select a Point browser. |
|
|
|
Opens a Popup menu to access point features. |
Configure array point trend lines
Array elements are numbered from zero (0) to one (1) less than the number of elements in the array.
Example
If ARRAY has ten elements, the individual elements are ARRAY[0] through ARRAY[9].
You may trend a single element of an array just as you can trend an ordinary line.
To trend a single element in an array:
Enter the array name.
Write the element's number in square brackets at the end of the array name.
For example, to look at the first element in ARRAY, enter ARRAY[0].
To trend an entire array at a single instant in time:
Enter the array name only.
The resulting display depends on the Line Type you have chosen.
|
Logged data |
The whole array is drawn as it was at the axis end time. |
|
Reference file |
The time of the array is provided in the file. |
|
Expression |
The most recent data for the array is displayed. |
Whenever the array data changes, the old line is erased and a new one, representing the new data, is drawn.
Arrays display, as follows:
Full arrays are shown with the first array element drawn at the left edge of the chart.
The elements of the array are equally spaced across the length of the chart.
The space between the last element and the end of the chart is equal to the space between the first two elements.
Disable point line scrolling
Select the Chart tab.
Click .
Clear the Allow runtime scrolling check box.
![]() Note: By default, point
lines scroll.
Note: By default, point
lines scroll.
|
|
Configure Array Point Trend Lines. |
|
|
Procedure to Disable Point line Scrolling. |
|
|
Option 4.2. Create a New Trend Chart Line (Overview of Detailed Method). |