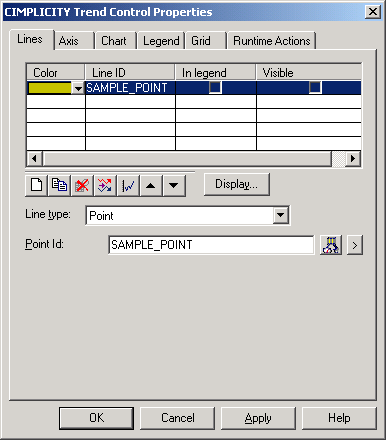
After you insert a Trend control on your CimEdit screen, you can configure its properties using the CIMPLICITY Trend Chart Properties dialog box.
Properties include:
|
Line |
Displays the associated point or expression data. |
|
|
Axis |
Defines the X and Y axes on the Trend. |
|
|
Chart |
Defines the chart characteristics of the Trend. |
|
|
Legend |
Defines the chart legend for the Trend. |
|
|
Grid |
Defines the grid display for the Trend. |
|
|
Runtime Actions |
Configure what runtime actions can be performed when viewing the chart. |
|
|
Array point trends. |
|
|
Step 3. Open the CIMPLICITY Trend Chart Properties dialog box. |