The System Log monitors Project Users' Actions in the Project Manager. All actions in the Project Manager are recorded and can be reported.
· Log In
· Log Out
· Start Node
· Stop Node
· Start View
· Start Draw
· Download database to Node
· Download Graphics
· Create or Delete SCADA Node
· Create or Delete a Project
· Log Data Maintenance modification
These can be sorted and filtered by Time, Date, computer, node and IP addresses.
An HTML report is displayed in the Web Browser. This report can be copied and pasted into EXCEL, Word or other office applications.
The System Log allows you to remotely monitor User Login, Start Node, Stop Node, View logins, Draw users, download database to SCADA Node, download Graphics to SCADA node, Restart SCADA node, etc. The System Log monitors connections to the Project Node (Web Server) and actions performed from the Project Manager. These are searchable by date, time, IP Address of the Client, etc. The System Log shows actions by Project Users. (Note – use the System Action Log to monitor Power User, General User, and Restricted User actions on the SCADA node, e.g. setpoint changes, auto/manual, start/stop equipment).
By selecting either custom search criteria or All Records, a report is generated (sample report shown below).
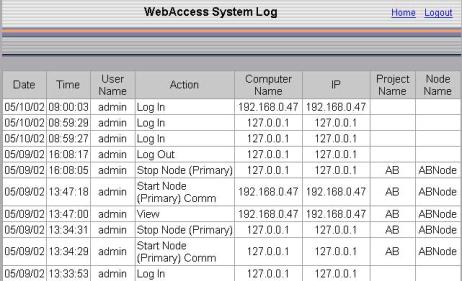
Figure 20.14 System Log - HTML Report
The System Log is not accessible in VIEW. The System Log is accessible only from the Project List Page. Only the Admin account and Project Users (who can access the Project Manager) can view the System Log.
To generate a report from the System Log:
System Log can be accessed from three locations:
1. Start Internet Explorer or other compatible Web Browser.
2. Connect to the Project Node.
3. Select WebAccess Configuration.
4. Login as an admin or a Project User.
5. The Project Manager Opens.
6. Select System Log
(Hint – if already logged in, select Home)
2) VIEW
Power User can also see the System Log
from VIEW using the Tools menu:
Right Click -> Tools -> System Log
3) ViewDAQ
All Users can also see the
System Log from ViewDAQ using the Tools menu:
Tools -> System Log
7. Select either All Records or Custom Criteria.
8. If "Custom" selected, then select search order, IP addresses, etc.
9. Press Submit.
10. A Report is generated.
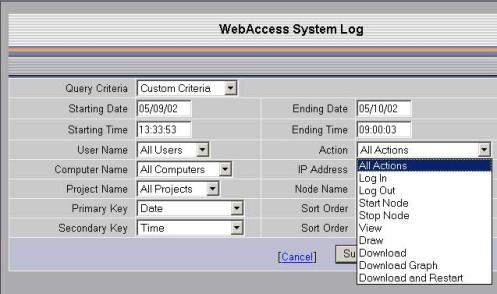
Query Criteria - Selecting All Records ignores fields other fields except Page Size. Custom Criteria allows you to use the other fields to limit the records included in the query and report.
Page Size - defines the number of ROWS in each page of the report.
Starting Date - is the Earliest Date the Query will search for records.
Ending Date - is the Most Recent date the Query will search for records.
Project Name -If you have multiple Projects, this will limit the project included. (Note – there is usually only one project in most systems). Use ALL Projects to query records from all projects.
Node Name – is the SCADA Node the query is applied.
User Name – is the Project User. (Note - Only Project Users and admin can access the Project Manager, download, start/stop nodes.)
Action – is the Project Manager actions used to configure tags, reports, build graphics, etc.
Log In – Project User Logins to Project Manager. (Note - see System Action Log for user logins to SCADA Node using VIEW).
Log Out – User logs out of Project Manager
Start Node – Start SCADA Node
Stop Node – Stop SCADA Node
Start View – Use the Start VIEW from Project Manager, SCADA Node Property page (see System Action Log for user logins to SCADA Node using VIEW outside of Project Manager or ViewDAQ).
Start Draw – Start DRAW from Project Manager – SCADA Node Property Page.
Download database to SCADA Node
Download Graphics using Graph Only link in SCADA Node Property
Create or Delete SCADA Node
Create or Delete a Project
Log Data Maintenance modification records Project Users changes to frequency and type of scheduled archive and scheduled data log record deletion.
To print a report is the same as printing a web page in your web browser. From Internet Explorer 6.0 web browser:
· Select File on the menu bar, then select Print (File-> Print)
· Or, select the Print Icon from the Web Browser toolbar
To “Copy and Paste” a report is the same as copying a part of a web page. From Internet Explorer 6.0 web browser:
· Left Click the Mouse on the Start of a Row.
· While holding the mouse button down, drag the cursor to the end of the last row (you can copy all rows or a few)
· Right Click the mouse on the highlighted rows.
· From the pop-up menu, select Copy. Or, select the Edit -> Copy from the Web Browser toolbar
· Select a cell in EXCEL or a Page in WORD. Select Paste from the menu bar in EXCEL, WORD or other office application.