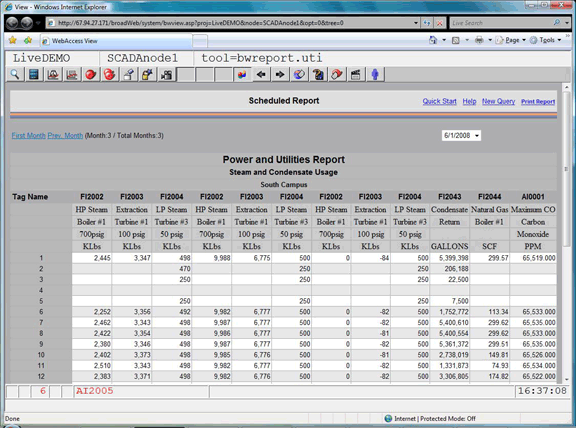

Figure 21.6 Monthly Report -View
The current Month’s report opens first. Reports can be viewed using VIEW, the Project Manager and ViewDAQ. The Monthly Report consists 28 to 31 rows of data for each Day of the Month. If the month is incomplete (e.g. it’s the 14th day), the report will show summary data based on the days accumulated.
There can be 12 Columns per report (twelve tags). A Cell can represent the Daily Average, Day’s Last Value, Daily Minimum, Daily Maximum or Daily Total of the Tag’s value for the time period the row represents (1 day).
Summary Data at the bottom of each Column can be calculated: Maximum, Minimum, Last Value recorded, Average and Total for the column.
If the Month is not complete, you will see blank rows of data for the future Days. Click Prev Month to see the most recent complete report if the current Month is not complete.
Emailed Monthly Reports appears almost identical, with Magenta and Blue borders.
The report is regenerated each time, so it can take a long time (several minutes) before it is displayed. The larger the database, the more time it will take. Using Log Data Maintenance to delete old data will speed the time of generating reports. In addition, using Email of Scheduled Reports can be used to save old reports and view the report more quickly from the Email Archive Folder.
First Month is the earliest date on record. Click First Month to re-generate a report for that date. The Date of the report appears at the top right of the report.
Prev Month is the previous Month, earlier than the report you are viewing. The Date of the report appears at the top right of the report
Next Month is the month after the current report you are viewing.
Last Date is the Last Month with any data. This is usually the current month.