Properties | Configuring an Alarm Analysis Object | Sorting Alarms | Filtering Alarms | Multiple Filters | Alarm Thresholds | Printing Options
You can display iFIX alarms from a relational database using the Alarm Analysis object. This object displays the retrieved alarm data and lets you filter and sort the data, much the same way that the iFIX Alarm Summary object does.
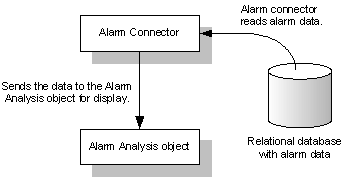
In order to use the Alarm Analysis object, you need to configure the Alarms connector using the Administration application. See Adding an Alarms Data Source for details. This connector reads alarms from a relational database table and displays the data in the Alarm Analysis object, as the following figure summarizes.

The column properties determine which columns to display and in what order. When you select a data source for the object, you can select the columns you want to include in the object. By default, the Alarm Analysis object displays the following columns:
|
Column Name |
Description |
|
Native Date/Time In |
The date and time the alarm first occurred. The supported date format is month/day/year (mm/dd/yyyy) and is determined by the Regional Settings. The default time format is hour:minute:second.subsecond (hh:mm:ss.n). You can change this to display time down to the millisecond. The date/time in this column is provided as a datetime data type. On Oracle databases, the data type is DATE. |
|
Native Date/Time Last |
The date and time the alarm last occurred. The supported date format is month/day/year (mm/dd/yyyy) and is determined by the Regional Settings. The default time format is hour:minute:second.subsecond (hh:mm:ss.n). You can change this to display time down to the millisecond. The date/time in this column is provided as a datetime data type. On Oracle databases, the data type is DATE. |
|
Logical Node Name |
The SCADA server that generated the alarm or message. If you enable logical node names in the SCU, the name of the SCADA server is the logical name you define. |
|
Tag Name |
The block (tag) that generated the alarm or message. |
|
Tag Description |
The description of the tag in an alarm state. |
|
Value |
The current value of the tag in an alarm state. |
|
Message Type |
The specific alarm type. Alarm types can be:
|
|
Message Description |
Text describing the alarm condition. |
|
Alarm Area |
The alarm areas of the tag in an alarm state. Alarm areas can be:
|
|
Alarm Status |
The alarm state of the tag. Examples of alarm states include:
|
|
Alarm Priority |
The alarm priority of the tag in an alarm state. Alarm priorities can be:
|
To these columns, you can add the following:
|
Column Name |
Description |
|
Alarm Ext.Field1 |
Data from the first alarm extension field of the block in an alarm state. |
|
Alarm Ext.Field2 |
Data from the second alarm extension field of the block in an alarm state. |
|
Date In |
The date the alarm first occurred. The supported date format is month/day/year (mm/dd/yyyy) and is determined by the Regional Settings. The date in this column is provided as a string data type. |
|
Date Last |
The date the alarm last occurred. The supported date format is month/day/year (mm/dd/yyyy) and is determined by the Regional Settings. The date in this column is provided as a string data type. |
|
Message ID |
A unique identifier for the row in the table supplied by the database. |
|
Operator Login Full Name |
The full name of the operator logged in (included for operator messages only, when security is enabled). |
|
Operator Login User Name |
The user name of the operator logged in (included for operator messages only, when security is enabled). |
|
Operator Node Name |
The node name of the computer that the operator is using (included for operator messages only, when security is enabled). |
|
Performed By Comment |
A comment provided by the person performing an action. This value is included when electronic signatures is enabled. |
|
Performed By Full Name |
The full name of the person performing an action. This value is included when electronic signatures is enabled. |
|
Performed By User Name |
The user name of the person performing an action. This value is included when electronic signatures is enabled. |
|
Physical Node Name |
The SCADA server that generated the alarm or message. |
|
Time In |
The time the alarm first occurred. The default time format is hour:minute:second.subsecond (hh:mm:ss.n). You can change this to display time down to the millisecond. The time in this column is provided as a string data type. |
|
Time Last |
The time the alarm last occurred. The default time format is hour:minute:second.subsecond (hh:mm:ss.n). You can change this to display time down to the millisecond. The time in this column is provided as a string data type. |
|
Unit |
The EGU label of the tag in an alarm state. |
|
User Field1 |
User-defined data. |
|
User Field2 |
User-defined data. |
|
User Field3 |
User-defined data. |
|
User Field4 |
User-defined data. |
|
Verified By Comment |
A comment provided by the person verifying an action. This value is included when electronic signatures is enabled. |
|
Verified By Full Name |
The full name of the person verifying an action. This value is included when electronic signatures is enabled. |
|
Verified By User Name |
The user name of the person verifying an action. This value is included when electronic signatures is enabled. |