NOTE: Annotations can be used only with Historian data sources.
In Time or Event charts, you can record comments or specific information about data in a chart by creating a chart annotation. You can annotate multiple data points in a chart or create multiple annotations for a single point.
The data points you annotate must be in a pen line that is configured for one of the following retrieval modes:
Interpolated
Lab
Raw by Time
Raw by Number
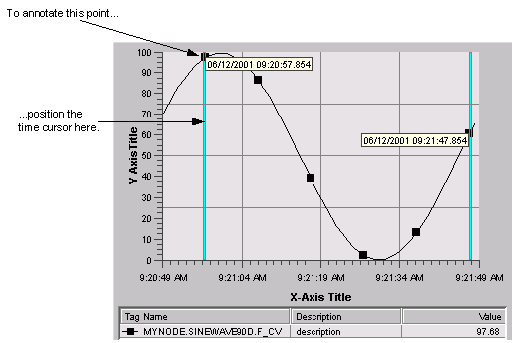
After you select an appropriate pen line, make sure the chart is also showing at least one time cursor and ToolTip. Position the time cursor so that the ToolTip appears for the point you want to annotate as the following figure shows.

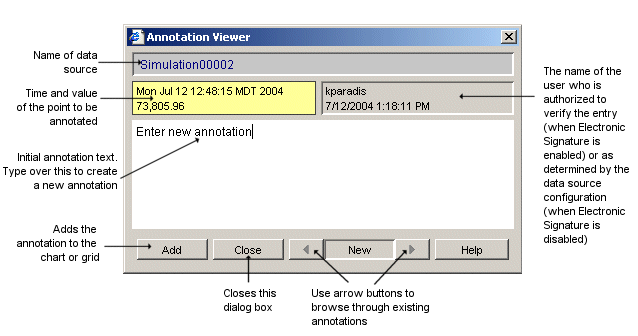
After you position the cursor, click a ToolTip to display the Annotation Viewer dialog box. This dialog box allows you to display existing annotations and create new ones. The following figure shows the initial information provided by the Annotation Viewer dialog box.

NOTE: The Annotation Viewer may reflect the annotation source time zone with certain client and server configurations. If the annotation source time zone is not displayed, the annotation time zone matches the time zone of the chart.
To create an annotation, enter the annotation text and click the Add button to add it to the chart. If you have the Electronic Signatures and Records (Enable Point Verification) option enabled on your Historian server, Proficy Portal prompts you for an authorizing user name and password before saving the annotation. The user name and password entered is one of the user accounts authorized for electronic signatures on your Historian server.
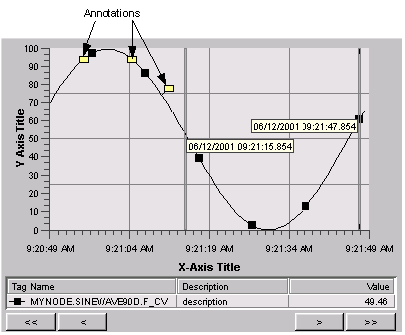
After you have entered the annotation, the chart shows an annotation for the point you selected with the cursor, as the following figure shows. If you annotated an interpolated value, Proficy Portal adds the annotation to the closest raw value to the point you selected. Consequently, the value displayed by the Annotation Viewer does not always match the value on the y axis.

After you create an annotation, you cannot edit or delete it. If you need to augment an existing annotation, you must create a new note for the same point. You can add another annotation by selecting the ToolTip again or by selecting the annotation you want to update.
When the Annotation Viewer dialog box appears, the first annotation is shown. Click the right arrow button to display the initial annotation text. When this text appears, enter the text of the new annotation.
You can browse existing annotations using the left and right arrow buttons. However, if you click past the first annotation or the last annotation, the dialog box assumes you want to create a new annotation and the initial annotation text appears. If you do not want to add an annotation, click an arrow button to return to the previous annotation.
Before starting: you must have a chart (in run-time) that displays pens and is set to display ToolTips, time cursors, and annotations. For more information, refer to Pens, Specify Category chart Tool Tip settings, and To set up a chart's axes and cursors.
Move the time cursor so that it displays a ToolTip and click the ToolTip. The Annotation Viewer dialog box appears.
NOTE: The value that is shown in the Annotation viewer is the raw data point value. If the data retrieval mode is set as Interpolated, the value in the chart that you are annotating will not appear as the same value in the Annotation Viewer. Proficy Portal adds the annotation to the closest raw value to the point you selected.
Enter the text of the annotation and click Add to save the annotation in the chart. If the Electronic Signatures and Records option is enabled on your server, the Electronic Signature dialog box appears. Proceed to step 3.
If the Electronic Signature dialog box does not appear, proceed to step 4.
Have your supervisor enter his or her user name and password into the fields provided and click OK.
Click Close to return to the chart.
IMPORTANT: You cannot annotate an XY chart. In a time or event chart, you can only annotate data points in a pen line that is configured with a retrieval mode of Interpolated, Raw by Time, or Raw by Number.