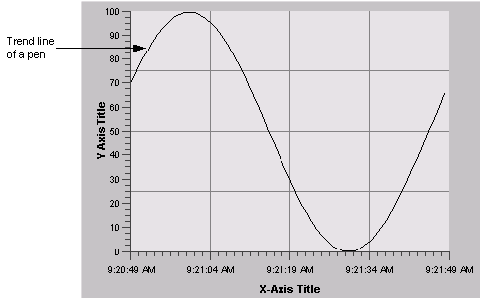
Before Proficy Portal can plot data in a Time, XY, Event, or Correlation chart, you must add a pen to the chart. A pen is a drawing element that has many properties you can configure. The configuration of a pen determines how specific trends appear in the chart. For example, you can select a data value (tag) to plot, its high and low limits, and the color to use when plotting the data. You can also define the width and style of the trend line or the precision (the number of decimal places) to use when plotting data.
Pens have optional features as well. For example, depending on the chart, a pen may have a line style or may display bad data in a different color.
NOTE: When you are adding pens to a chart, it is recommended that you set a limit of 15 on the number of pens. If you have more than 15 pens in a chart, the pens may not display correctly when stacked.
The following figure shows a pen in a Time chart.
