Engineering the picture switch function |
|
Manual -> Energy Management System (EMS) -> Parameterization of the EMS -> Engineering the picture switch function |
Engineering the picture switch function |
|
Manual -> Energy Management System (EMS) -> Parameterization of the EMS -> Engineering the picture switch function |
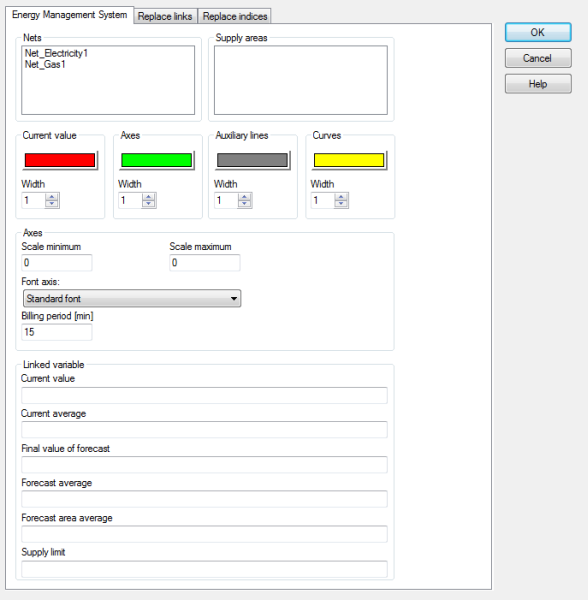
When creating a picture switch function for a picture of the type Energy Management System the following dialog is displayed:

During the Runtime the EMS picture is opened with the help of a picture switch function. For the picture call-up the following parameter can be set:
|
Name of the property |
Description |
|---|---|
|
|
Selection of the grids. After that the
available areas are displayed in the selection box |
|
|
The selected supply area is displayed in the Runtime n of the optimization. Only one supply area can be displayed per picture. You have however the possibility to open several pictures of the type "Energy Management System" parallel. At that several supply areas can be displayed parallel. |
|
|
This field is only for display. You cannot change the value. The variable of the property Current value of the currently selected supply area is displayed. |
|
|
This field is only for display. You cannot change the value. The variable of the property Final value forecast of the currently selected supply area is displayed. |
|
|
This field is only for display. You cannot change the value. The variable of the property Forecast average of the currently selected supply area is displayed. |
|
|
This field is only for display. You cannot change the value. The variable of the property Forecast area of the currently selected supply area is displayed. |
|
|
This field is only for display. You cannot change the value. The variable of the property Supply limit of the currently selected supply area is displayed. |
|
|
Upper limit of the range scale for the display of the characteristic curve in the EMS picture. |
|
|
Lower limit of the range scale for the display of the characteristic curve in the EMS picture. |
|
|
This field is only for display. You cannot change the value. Shows the currently set length of the Billing period for the selected supply area. |
|
Value color and width |
Color and line width for the display of the elements for the current average value and for the forecasted average value. |
|
Axis color and width |
Color and line width for the display of the chart axes. |
|
Help line color and width |
Color and line width for the display of the help lines (display of the supply limit and billing period). |
|
Curve color and width |
Color and line width for the display of the chart curves (display of the current value and the scheduled switchings). |
|
Font axis |
Font which is used for the axis caption and the trend curve. |