Frame configuring |
|
Manual -> Extended Trend Module (ETM) -> Engineering in the Editor -> Frame configuring |
|
|
Frame configuring |
|
Manual -> Extended Trend Module (ETM) -> Engineering in the Editor -> Frame configuring |
|
|
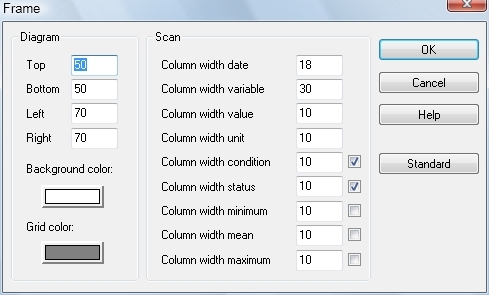
Further determinants for the representation of
the diagram can be defined by the setting of the frame
(Border button).

Optional Settings:
|
Top |
Distance between the upper edge of the
control element and the trend curves represented inside it. |
|
Bottom |
Distance between the lower edge of the
control element and the X-axis (Origin 0%-Y-axis) |
|
Left |
Distance between the lower edge of the
control element and the X-axis (Origin 0%-Y-axis) |
|
Right |
Distance between the lower edge of the
control element and the X-axis (Origin 100%-Y-axis) |
|
Background colour |
Background colour of the displayed graphics |
|
Grid colour |
Colour of the overlying grid |
|
Standard |
Set standard parameters |
|
Scan |
|
|
Column width date |
Column width for the time stamp in the legend |
|
Column width variable |
Column width for the variable name in the legend |
|
Column width value |
Column width for the variable value in the legend |
|
Column width unit |
Column width for the unit in the legend |
|
Column width condition |
Column width for the condition in the
legend |
|
Column width status |
Column width for the condition in the
legend |
|
Column width minimum |
Column width for the minimum of the
variable value in the displayed time period in the legend |
|
Column width mean |
Column width for the mean value of the
variable value in the displayed time period in the legend |
|
Column width maximum |
Column width for the minimum of the
variable value in the displayed time period in the legend |