Y axis parameters |
|
Manual -> Extended Trend Module (ETM) -> Engineering in the Editor -> Y axis parameters |
|
|
Y axis parameters |
|
Manual -> Extended Trend Module (ETM) -> Engineering in the Editor -> Y axis parameters |
|
|
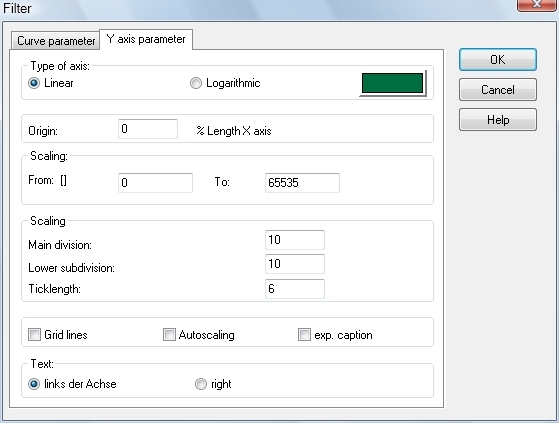
In this dialog and in the dialog Curve parameters the curve parameters are defined.

Configurable options are:
|
Axis type |
Defining of the scaling of the Y-axis |
|
- Linear |
Linear division of the Y-axis |
|
- Logarithmic |
Logarithmic division of the Y-axis |
|
Origin |
Position of the Y-axis in the diagram. (0 = Left, 100 = Right) |
|
Scale |
Define representation range of the process variables within their configured technical limits. (Zoom function) |
|
Axis subdivision |
Definition of the axis subdivision |
|
- Main subdivision |
Number of main subdivisions with value indication |
|
- Lower subdivision |
Number of subdivisions between two main subdivisions |
|
- Tick length |
Length of the main subdivision lines (pixel) |
|
Grid lines |
Representation of help lines on the main subdivisions |
|
Autoscaling |
Automatic setting of scaling and axis subdivision in online operation. |
|
Legend |
Position of the axis labelling |
|
Left |
|
|
Right |
|
|
Color |
Defining of the axis colour (CAUTION: Can be configured independently of the trend curve colour) |
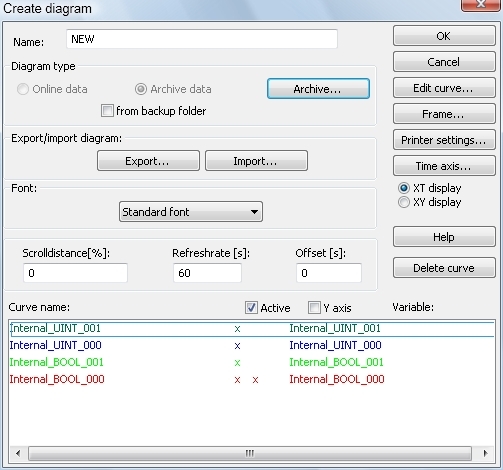
After the configuring of the trend curves and the associated Y-axis parameters, the new trend curve is accepted into the diagram by pressing the "OK" button. It is displayed in the diagram as an available trend curve (trend curve name, process variable name).
For each trend curve the corresponding type of processing (active, with Y-axis) has then to be laid down. The configuring is done by marking the trend curve in the window and setting the appropriate option.