Advice on online operation |
|
Manual -> Extended Trend Module (ETM) -> Operating during Runtime -> Advice on online operation |
Advice on online operation |
|
Manual -> Extended Trend Module (ETM) -> Operating during Runtime -> Advice on online operation |
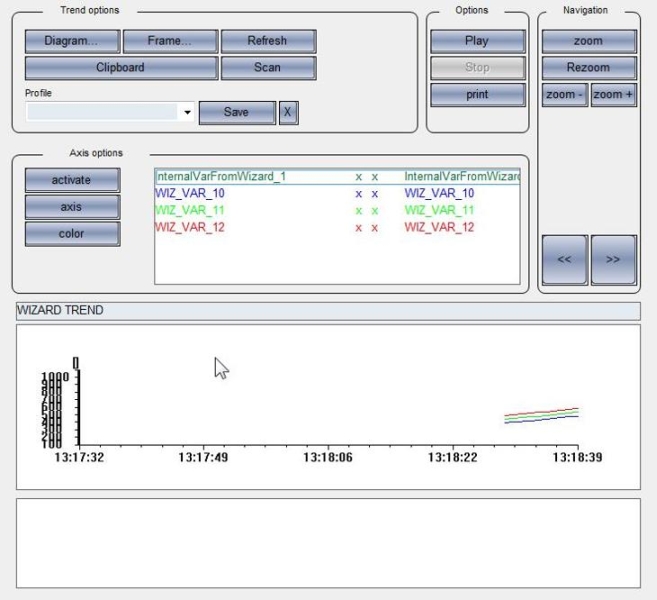
The current diagram name can be shown on a control element on opening the diagram in online operation.
Pressing the Zoom button gives the possibility of representing the available values in a finer resolution and in a smaller interval (X- and Y-axis). The zoom procedure is activated after pressing and pulling out of an area on the diagram. Multiple zooming is possible. Zooming is only possible if the selected area covers at least one subdivision per axis.
Pressing the Rezoom button switches the zoom factor back in the steps in which it was previously defined.
If in extended trend archive values are displayed or if the continuous updating of the online data is switched off then the current values of the curves up to the current time are re-read in by pressing the Refresh button. Or it is refreshed correspnding to the refreshtimes defined in the diagram.
Paging in extended trend beyond the represented
X-axis is possible with the use of the << button (display older values)
or >> (display more
recent values). If online data are displayed a maximum HD entry
depth as defined for the process variables can be represented. If
archive values are represented then the configuration of the
archive stored in the database is decisive.
With Online data and refreshing the visualisation changes with each refresh corresponding to the most current entry. If scrolling is unwanted the refresh has to be stopped in the online data. Switching off is done by pressing the "Stop" button. Paging and zooming are possible. If the continuos updating should be reactivated then the Play button is to be pressed. With the diagram's next refresh cycle the new data and the new X-axis range are updated.

The displayed details are:
|
Curve color |
Text in color in which the curve is configured |
|
Date |
Date stamp of the interrogated value |
|
Time |
Time stamp of the interrogated value |
|
Name |
Curve name |
|
Value |
Technical value |
|
Limit value display |
Display of a set limit value if the setting is in the projekt.INI file. |
|
|
[EW_TREND] |
|
|
ANZEIGE_GWTEXT=1 Limit value text |
The value display is updated by moving the mouse over the line representation. The value display is switched off by repressing the "?" button.