Operating during Runtime |
|
Manual -> Extended Trend Module (ETM) -> Operating during Runtime |
Operating during Runtime |
|
Manual -> Extended Trend Module (ETM) -> Operating during Runtime |
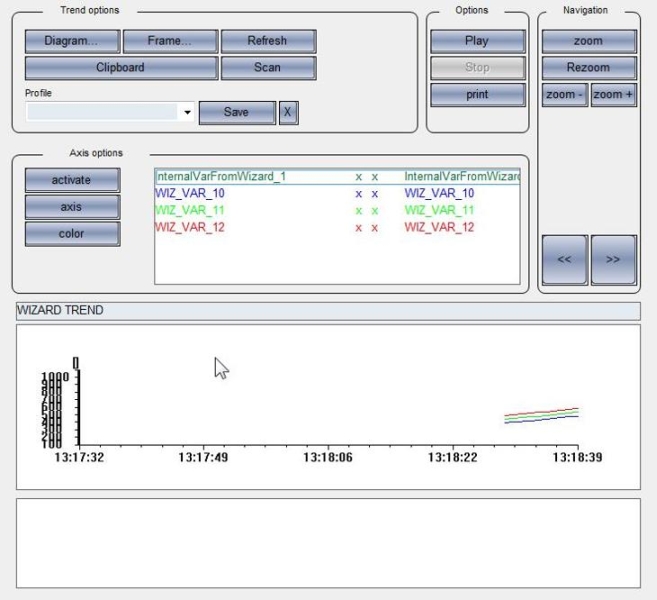
In online operation the window for the extended trend is opened via a function call (e.g. button). The online mask of the screen predefined in the editor is opened.

The possible online operations are:
|
|
Selection of the curves and the curve parameters |
|
|
Settings for diagram background, X-axis and X-axis labelling. |
|
|
Update screen After stop-selection or on representation of archive values from currently running archives. |
|
|
Copy representation into the intermediate store |
|
|
Query values Shows scan values in the scan window under the diagram. More information see below. |
|
|
Save and delete profiles |
|
|
Continually update the representation of the online values / Do not update any more |
|
|
Print diagram representation |
|
|
Enlargement of the representation after pressing the button and pulling out an area in the diagram. |
|
|
Reverse previous zoom step |
|
|
Enlarge / reduce display area |
|
|
Activates the display of the curve in the diagram |
|
|
Representation of the curve's Y-axis |
|
|
Changes the color of the marked curve |
|
|
Page through the representation range into the past |
|
|
Page through the representation range in the direction of the latest values. |
The buttons are released and locked according to their function.
Scan
Click on the button Scan.(query values) in order to start
the scan mode. Move the mouse pointer over the diagram and you will
see the values at the associated time in the scan window. Click on
button Scan again in order
to end the scan mode You can display the following information in
the scan window:
|
Date |
Date/Time of the saved value |
|
Variable |
Variable name of the saved value |
|
Value |
Technical value of the saved value |
|
Unit |
Unit of the saved value |
|
status |
Condition text (limit value text) of the saved value |
|
Status |
Status of the saved value |
|
Minimum |
Minimum of the display range (optional) |
|
Average |
Average of the display range (optional) |
|
Maximum |
Maximum of the display range (optional) |
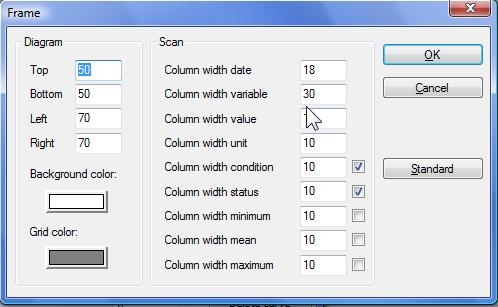
In order to change the displayed information
and the according column widths, click on the button Border.. ; the window Border opens (see screenshot).
In the are Scan you can set the column widths for the different entries in the scan window. With the checkbox you can determine which information should be displayed in addition to the fixed information (date, variable, value, unit). With the button Standard you can load the standard settings.
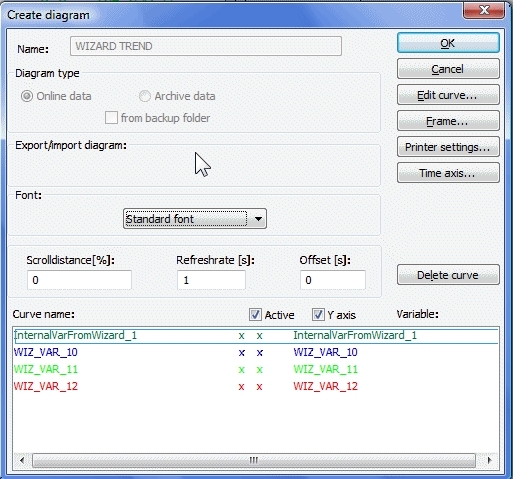
Diagram settings
From the existing configuration, which was done
in the editor, temporary changes (without saving) can be carried
out in runtime. Click on the button Diagram... to open the window
Create diagram (see
Screenshot).
Possible changes are:
|
Active |
Activates and deactivates the display of the curve |
|
Y-axis |
Representation of the curve's Y-axis |
|
Edit curve |
Editing the settings of the selected trend curve |
|
Frame |
Settings of the diagram parameters |
|
Font |
User defined font for X- and Y-axis labelling and value indication |
|
Refresh rate |
Updating of the diagram for online data |