Each Column in a Report represents the data from one Analog Tag recorded to the ODBC Analog Tag Log. Shift, Daily and Monthly versions of the report use the same Tags, columns and Data.
Different calculations (Average, Total, Min, Max, Last Value) can be performed in the Shift, Daily and Monthly Reports. These are specified under the Tag Property Button for each report.
The Titles of the Columns for the Reports are specified in the Tag Property for each report (a column represents one Tag’s data). The three reports can have different Titles for each column or share the Titles based on another report (e.g. import Shift Report Titles to Daily, or Daily into Monthly).
To Configure the Shift Report Tag Properties:
1. Add a Scheduled Report or select Update from the Scheduled Report List (Figure 21.10).
2. Click the Tag Property button listed under Shift Report (Figure 21.12).
3. The Shift Report Tag Property page opens.

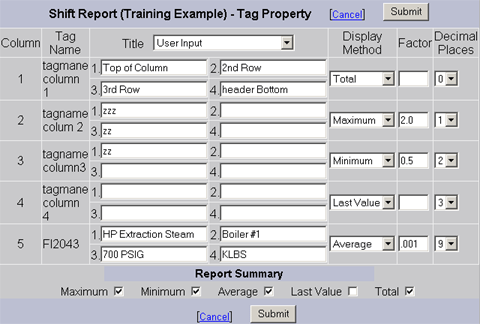
Figure 21.13 Shift Report Tag Property
4. There can be up to 12 Columns per report (twelve tags).
5. You can import Title information, if another version of this report (Daily or Monthly) has already been configured with Tag Property.
a. From the pull down list next to Title, the choices are
i. User Input - Title information entered or edited manually here.
ii. Import from Daily – will import the Titles from the Daily Report version (if configured).
iii. Import from Monthly – will import the Titles from the Monthly Report version (if configured).
b. You can edit the Titles with Import from Daily or Import from Monthly selected; this will not change the Daily or Monthly reports.
c. Selecting User Input will return to the Titles last saved using the Submit button. Once you press submit, the User Input version becomes the current titles displayed.
d. If you can’t import, then manually enter the Header Title information for each Column of the Report. There are 4 text lines per header on each column. See Shift Report for an example of Column Headers.
6. Display Methods defines a calculation for the data collected the tag (Average, Minimum, Maximum, Last Value or Total). This defines how each “cell” in the report calculated from the records in the ODBC Log database.
a. Average is the simple average of the values (Total / no. of records) for the recording interval this row represent.
b. Maximum and Minimum are for the recording interval this row represents.
c. Total is the simple sum of all records for the recording interval this row represents. You must consider the engineering units of the tag, the Log to ODBC Frequency, the deadband, the number of samples recorded because of the deadband, the Recording Interval for the Shift Report and the Factor for this report to make this a meaningful total.
Average is the easier way to calculate Total. The easiest way to make sure your Totals are meaning full is to use:
Average and a Recording Interval = the time units of Tag’s Engineering Units.
This makes the Total independent of the Log To ODBC frequency, the Deadband for the Tag and the number of sample actually recorded in the ODBC Log.
For example, if the tag’s engineering units are Gallons / Hour, a Recording Interval = 60 minutes results in a Total value if Average is used regardless of the Log to ODBC Frequency. (I.e. the Total Flow over 1 hour period is the same as the Average Flow Rate / Hour for the one hour period).
d. Last Value is the last value recorded for the tag during this recording interval. This is typically used for closing inventory on Tanks or meters.
The calculation for each cell applies to all records found in the ODBC log for the Recording Interval this row represents (5 minutes to 60 minutes). The Recording Interval was defined on the first configuration page of this Shift report (See Add Scheduled Report). The user should ensure this period is greater or equal to the ODBC record frequency for the tag.
7. Factor is a multiplier used for units and time conversion. For example, if the tag engineering units are gallons / per minute and your total is for a one hour interval, you need a multiplier of 0.0167 (1/60). The result of the Average, Minimum, Maximum, Total or Last Value calculation is multiplied by this factor.
8. Decimal Places defines how many digits after the decimal point (e.g. tenths, hundredths, thousandths) will be displayed in the report.
9. Report Summary defines the rows at the bottom of each column. Summary Data at the bottom of each Column can be calculated: Maximum, Minimum, Average, Last Value and Total for the column.
10. Press Submit to save these entries. Download to the SCADA Node to make these changes effective.