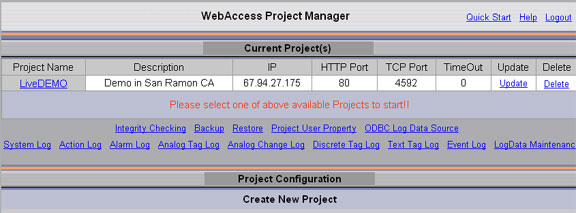
This shows a centralized Alarm Log for all SCADA Nodes and all projects with Alarm Log to ODBC enabled.
From the Project Manager, Project Users can see the System Alarm Log from the 'Project Home' page.
Power
Users can also see this Action Log from VIEW using the
Tools menu:
Right Click -> Tools -> System Alarm Log.
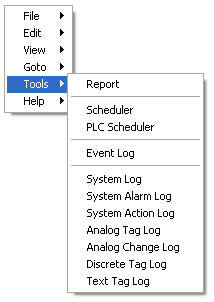
All Users can also see this Action Log
from ViewDAQ using the menu bar:
Tools -> System Alarm Log.
These can be sorted and filtered by Project, SCADA Node, Date, User Name, computer, Priority, IP address and Tag Name.
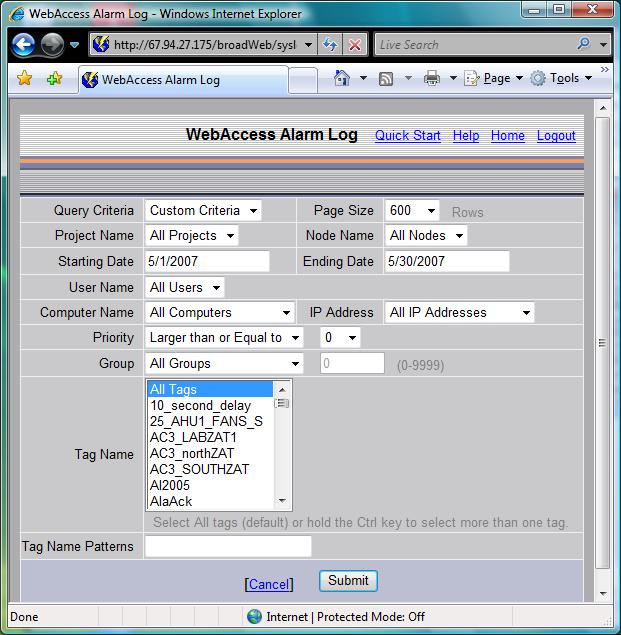
An optional Tag Name Patterns field isto let users search for patterns using wildcard characters when “All Tags” is highlighted. The wildcard characters are database dependent (.e.g Access, SQL Server, Oracle, MySQL) used to store ODBC data. For an Access database, use % (percent symbol) to match any number of characters and _ (underscore) to match any single character.
An HTML report is printed.
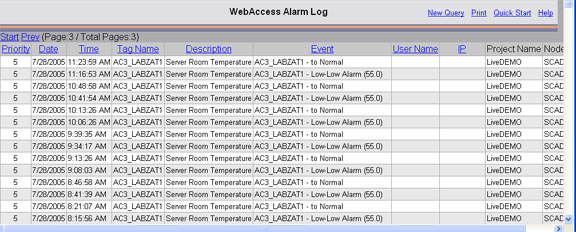
The HTML report displayed can be copied and pasted into EXCEL, WORD and other office applications preserving the cell, column and other formatting.
Data can be exported to EXCEL (VIEW and ViewDAQ to EXCEL 2000 or later, the Project Manager requires EXCEL 2002 or later). See 21.3.2 Export to EXCEL from ODBC Log
The default number of records per page for log displays is to 600.
For more information, refer to Alarm Login the System & Template Displays section.
The system display used in VIEW is bwalmlog.uti
The data is contained on the Project Node at drive:\WebAccess\Node\bwPDATA.mdb
The database table is BwAlarmTable: Alarm log table
a. ProjNodeId : Unique ID for a SCADA node.
b. LogDate : Date of the record was recorded.
c. LogTime : Time of the record was recorded.
d. Priority : Alarm priority.
e. TagName : Tag name.
f. Description : Tag Description
g. Action : Alarm information
h. UserName : User involved in the alarm action.
i. NodeName : SCADA Node
j. NodeIP : Not used.