This section assumes:
· You have already created the BLOCKS and TAGS you plan to add to your RealTime Trend Displays. You can type in the Tag Names and Block Names of tags and blocks you plan to build.
·This section assumes you have started Internet Explorer Web Browser and connected to your Project Node.
1. Start WebAccess Configuration.
2. Login with User Name and Password.
3. Select your Project.
4. Select the SCADA Node.
5. The SCADA Node Main page opens.
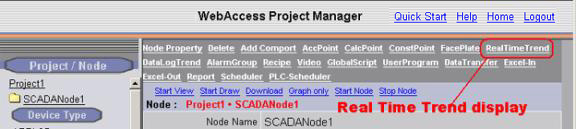
Figure 6-9 Real Time Trend display Group - Project Manager
6. Select RealTime Trend.
The RealTime Trend List Page appears.
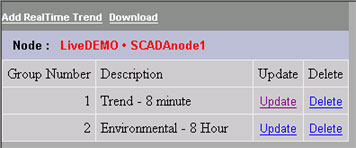
Figure 6-10 Real Time Trend List - Project Manager
7. Select Add RealTime Trend.
8. The Create New RealTime Trend Group appears.
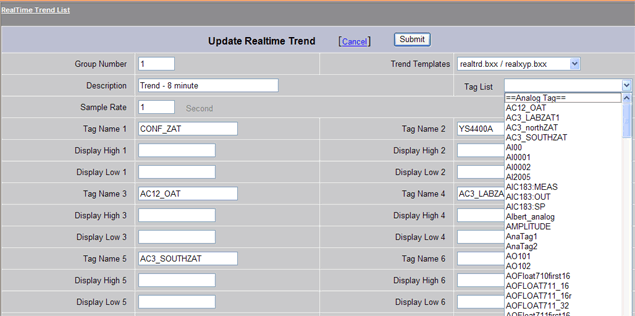
Figure 6-11 Create Real Time Trend Display
9. Enter a unique Group Number (between 1 and 1000). This is how the Group will be ordered in the RealTime Trend Dialog Box in VIEW and identified to Operators and Users.
10. Enter a Description for the group. This will appear in the RealTime Trend Group List Dialog Box seen by users and operators in VIEW. 32 characters is the maximum length.
11. Optionally, select a different Trend Template; dlogtrd.bxx is the default. Users can create use multiple trend templates (e.g. different colors and layouts) in the same project. For example some trend groups can have black backgrounds to facilitate viewing while others have white to facilitate printing on paper. Users can create and assign up to 100 extra customized trend graph templates for Realtime Trend groups. For more information, see 6.3 Real-time Trend Displays.
12. Enter a Sample Rate. This is the frequency of updating the Trend Display with new Data. RealTime Trends are fixed at 240 samples. Sample Rate for Realtime Trends range from 1 to 180 seconds.
If 1 second interval and 240 samples = 1 x 240 = 240 seconds (4 minutes)
If 180 second interval and 240 samples = 180 x 240 = 43200 seconds
13. Select the field next to Tag Name 1.
14. Open the Pull down list by clicking on Tag List (Figure 6-11). This shows the names of all Analog Tags and Discrete Tags.
15. Scroll down the Tag List. Click the Tagname desired. The Tagname should appear on the Tag Name 1 field.
16. Repeat for Tag Name 2 to 12.
17. You can Type Tag names and Blocks (BLOCK:PARAMETERs). You can also copy and paste Tag Names and Block Names from the Left Frame of your browser.
18. The Display High and Display Low to "zoom in" or "zoom out" of trend data. By default, WebAccess uses the High Span and Low Span of the Tag. DataLog Trend Displays have configurable Display High and Display Low values for the y-axis (and x-axis in X-Y Plots). Trend displays will “remember” changes made to Display High and Low from VIEW and ViewDAQ. The Display High and Low are assigned to the Trend Group, allowing the same tag to have different sets of Display High and Low when assigned to multiple display groups.
18. Click Submit when you are finished.
20. There are two ways to download these changes to the SCADA Node:
20a. Download and Restart the SCADA node from the SCADA Node properties page. If you have never downloaded the SCADA node before, then this is required. This will temporarily stop the SCADA node (if it is running).
OR
20b. Use the Download hyperlink on the RealTime Trend List Page (figure 6.10 above). This will download changes to the Real-time Trends without stopping the SCADA node.
At least one Real-time Trend Display group must be configured to view Real-time Trends. The New Tag button can be used to add tags (temporarily) to any Real-time Trend Display. If your users will regularly view the same tags in a trend, it is probably best to configure multiple Data Log trend groups for their convenience.