OR
The Point Info Dialog Box is a menu of all Points (IO Tags, Blocks and system Tags) plus information about them, including current value, alarms, Displays they appear. The Point Info Dialog box also has the ability to change the value of tags based on user security and will open a login dialog box if user security is too low.
The tags listed are based on user login. Restricted Users will only see tags from their assigned displays. General and Power Users will see all tags.
1. Call up the Point Info tag browser by one of these methods:
a.
Select ![]() on the standard Toolbar (Figure 3.3)
on the standard Toolbar (Figure 3.3)
OR
b.
Use the Navigation Popup Menu (Figure 3.2) in a
web browser VIEW:
Right Click -> Goto -> Point Info
OR
c.
From the ViewDAQ menu bar select, Goto -> Point
Info
OR
d. Press CTRL + F5 on your keyboard
2. The Point Info Dialog Box appears (Figure 4.4).
3.
Select the I/O Tag button ![]() to view all Tags and Blocks from field
devices (i.e. real IO). This is the most common method.
to view all Tags and Blocks from field
devices (i.e. real IO). This is the most common method.
The Alternative methods are:
i. Select Port1, Port2, Port3, to view Tags by communications port (e.g. Comport 1, Comport 2, Comport 3, etc). Use the up / down arrow keys to view other comports. See Port for more information. OR
ii. Select Constant, Calculation or Accumulation to see internal Calculation or "Totalizer" tags. These are internal tags used for inputting "constants" or other operator input to equations, reports and calculations. See ViewDAQ Tags for more information. OR
iii. Select %ViewDAQ to see system tags used to customize Web Access. In addition, Local tags used for screen animation and calculations are listed here.
4. Select a point or Tag from the list on the left of the dialog box. (For example, pick SPEED in Figure 4.4). You can also type the tag name using the keyboard.
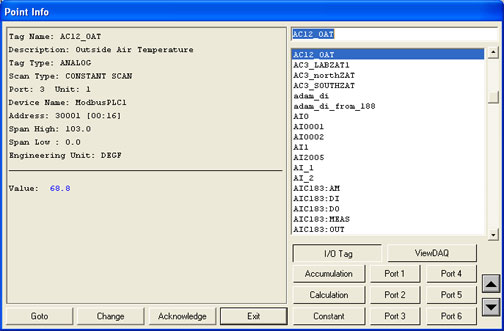
Figure 4.4 - Point Info Dialog Box
The Point Info Dialog Box shows the current Value, Description, Point Type, High and Low Span and Engineering Units.
The Change button ![]() will open the Change Dialog
box allowing an operator to change the value of the tag (with
the appropriate security).
will open the Change Dialog
box allowing an operator to change the value of the tag (with
the appropriate security).
The Acknowledge button ![]() will acknowledge the highest
alarm associated with the tag (the tag should stop flashing).
If there are multiple alarms, then the acknowledge button must be
pressed multiple times. The Alarm Summary describes
the alarm type associate with tag. Restricted Users can be prevented
from acknowledging alarms, depending on the security assigned to
them.
will acknowledge the highest
alarm associated with the tag (the tag should stop flashing).
If there are multiple alarms, then the acknowledge button must be
pressed multiple times. The Alarm Summary describes
the alarm type associate with tag. Restricted Users can be prevented
from acknowledging alarms, depending on the security assigned to
them.
The Goto button ![]() opens the Goto Point
Info list of all the displays and trends the tag is used
on.
opens the Goto Point
Info list of all the displays and trends the tag is used
on.
Value: Flashing Red means the tag is in Alarm. Asterisks (*) or a number in brackets means a communications failure. Blue is Normal.
The Tag name (or Block and Parameter Name) is how WebAccess identifies this information on displays, logs, alarms, trends and reports. A typical tagname is FIC101 or AC3_OAT.
Description: is the user assigned description for this tag used in displays and alarms. A typical description is Boiler #1 Feedwater Flow. The description is 25 alphanumeric characters.
You can change the description on-line by appending .DESCRP to the tagname (and have a 127 security level for Tag Fields). This change will remain until the next restart of the SCADA node.
Tag Type: is the Data Type of the tag or parameter. The types are Analog, Digital or Text.
Analog is a floating Point Number (e.g. 0, 101.234, 100, -999.1).
Digital is a state between 0 and 7, usually with a Descriptor (e.g. RUN, STOP, ON, OFF). Digital is also called Discrete.
Text is ASCII data consisting of letters and numbers. .
Scan Type defines the type of scanning performed by the Tag or Block Parameter.
Constant Scan means the Tag is always scanned as long as the SCADA node is running. Constant scanning must be used for all I/O points that require continuous update (alarming, trends, logs, batch, scripts, logic).
Display Scan is for infrequently accessed tags, like tuning parameters and setpoints. Display Scanning occurs only when a Display is being viewed with this tag on it. Display Scan is a means of optimizing or increasing communications throughput.
Some drivers provide other Scan options. Scan Type is chosen from a pull down menu showing valid scan types for this device.
This is also called the Com Port. This is the communications port the tag is using to read or write data from automation devices including PLCs, Controllers and IO. The STATION STATUS Display can be used to view the status of the comport. The %DAQ System Tag can also be used to monitor the Status of the comport using %DCOMST(tagname.COM). Comport numbers less than 1 represent Internal Tags (Accumulation, Constant, Calculation, System and Screen Tags). For IO Tags and Blocks, the COM Port is the physical comport configured in WebAccess Configuration Manager. For Network and Software Interfaces (like DDE, OPC and API), the COM port may be a virtual number. For Serial and some API interfaces, the comport is the physical communications port (i.e. COM1, COM2, COM3, etc.).
-1 = Accumulation Tag (Internal Tag)
-2 = Calculation Tag (Internal Tag)
-3 = Constant Tag (Internal Tag)
0 = Local Screen Tag or %DAQ System Tag (Internal Tag)
1 to 60 = Physical Comport (Com1, Com2, etc)
You can select the comport using the
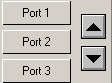 keys. Use the Up / Down arrow
keys to see I/O yags on up to port 60.
keys. Use the Up / Down arrow
keys to see I/O yags on up to port 60.
The Unit Number describes the field device (e.g. PLC, RTU, Controller) this tag reads. Depending on the driver, this may be the physical address of the device. Technicians and engineers configure unit Number when they create the device in WebAccess Project Manager. The STATION STATUS Display can be used to view the status of the comport. .
Device Name is a description of the Automation device the tag connects in order read or write data. Automation devices include PLCs, Controllers and IO. Typical Device Names are PLC1, CTL202, and VAV300. Engineers and technicians assign the Device Name when they create the Device in the WebAccess Project Manager.
Address of data in the field device to be read or written by this tag or BLOCK:PARAMETER. Address is initially set when the Tag or Block was built. Address is very device dependent. Refer to the device driver manual for more details.
Span Hi describes the intended maximum value of the tag. Depending on how the tag was built, this may be the true maximum or just an indication that maybe ignored. Span Hi is used by some Scaling Types to "re-scale" the value read from the PLC. For some Scale Types, Span Hi is the maximum value of the Tag. For other, Scale Types, Span Hi is for display use only. For example, if No Scale is selected, the Span appears on Trends and Displays, but is informational only. The actual value can exceed Span Hi if no scale is used. (See Scaling Type for more details).
Span Hi is used by Trends, Overviews, and user built animation to determine the Maximum Value of the Tag. For example, if a tank is filled by a Tag, the Hi Span is used to determine the tag' value for a Full Tank. This field is for ANALOG tags and parameters only.
The Range: -99,999,999,99 to 99,999,999,999
Tag field: .SPANHI
You can change the Span High on-line by appending .SPANHI to the tagname (and have a 127 security level for Tag Fields). This change will remain until the next restart of the SCADA node.
Span Lo describes the intended maximum value of the tag. Depending on how the tag was built, this might be the true maximum value or just an indication.
Span Lo is used by some Scaling Types to "re-scale" the value read from the PLC. For some Scale Types, Span Lo is the minimum value of the Tag. For other, Scale Types, SpanLo is for Display Use only. For example, if No Scale is selected, the SpanLo appears on Trends and Displays, but is informational only. The actual value can exceed Span Lo if no scale is used.
Span Lo is used by Trends, Overviews, and user built animation to determine the Minimum Value of the Tag. For example, if a tank is filled by a Tag, the Span Lo is used to determine the tag' value for an empty Tank. This field is for ANALOG tags and parameters only.
Range: -99,999,999,99 to 99,999,999,999
Tag field: .SPANLO
You can change the Span High on-line by appending .SPANLO to the tagname (and have a 127 security level for Tag Fields). This change will remain until the next restart of the SCADA node.
Engineering Units are typically Gallons, DegF, %OPEN, %LEVEL, PSIG, etc. Engineers and operators use Engineering units to better understand the number displayed by the tag. For example, volume in a tank can be measured in Gallons, Liters, Feet, Inches, Meters or Percent Full. Engineering Units is text that will be displayed on all displays that reference the ENUNIT field of the tag. Engineering Units are limited to 12 characters. This field is for ANALOG tags and parameters only.
Range: any text string, up to 12 characters
Tag field: .ENUNIT
You can change the Span High on-line by appending .ENUNIT to the tagname (and have a 127 security level for Tag Fields). This change will remain until the next restart of the SCADA node.
Упал насос в скважину мы поможем достать vodasoshelp.ru.