A grid displays tabular data similar to a spreadsheet. Any data type can be used in grid objects; however, the Grid should be used to display relational data and the Historian grid should be used for time-based data sources.
You can add the following types of grids to an analysis display:
Grid – displays SQL data and data from other sources including OPC and iFIX.
Historian Grid – displays Historian data.
Alarm Analysis – displays iFIX alarms from a relational database in tabular format.
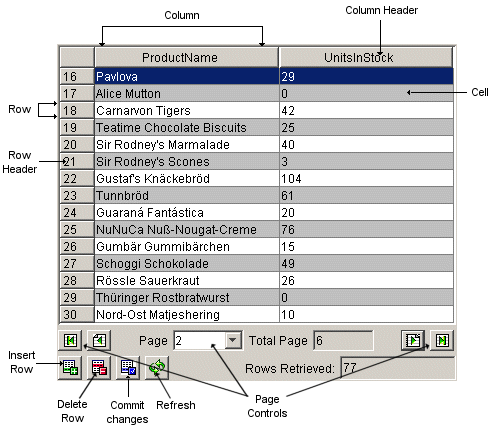
The following example shows the basic elements of a grid:

As shown in the previous diagram, all grids have rows, columns, and cells. Column headers and row headers provide a title or reference for columns and rows. Either the column header or the row header will display the column names from the data source, depending on the type of fill direction chosen in the configuration panel. For example, if the fill direction for the grid was configured as horizontal (instead of vertical), then the column names would appear as the row headers and the numbers would appear as the column headers.
Grids have two display modes: scrolling or pagination. When scrolling is selected, you can scroll through a grid with the scroll bar on the right. When pagination is selected, the grid shows only as many rows as will fit given the grid's current size. To view additional rows, select a different page. The previous screen capture shows a grid that displays with a pagination display mode. The page controls at the bottom of the grid allow you to navigate through the data.