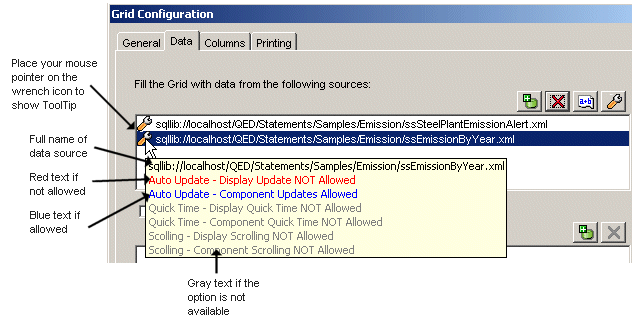
If you want to quickly review the time update settings configured for a data source on a chart (excluding Quality charts), grid, or tree object, you can look at the settings without opening the Advanced Settings dialog box. When you place your mouse pointer over the `wrench' icon beside the data source, a ToolTip appears that provides you with the time update settings details. The following figure shows you how to access the ToolTip and what the colors on the ToolTip indicate.
