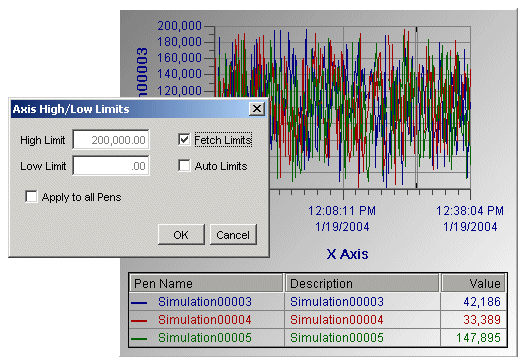
The high and low data limits on the axes of trend charts (that is, Time, Event, XY, and Correlation charts) can be changed by modifying the pen configurations in the chart's Configuration panel. Additionally, a quick method of changing the high and low limits is available on the chart during run-time. In the following example Time chart, double-clicking the y axis (area shown with mouse pointer) opens the Axis High/Low Limits dialog box.

On some charts, such as the XY or Time chart, you can change the high and low limits of both the x and y axes. You cannot, however, change values on a time axis.
While in run-time, double-click the axis on the chart you want to change the high and low limits for. The Axis High/Low Limits dialog box appears.
In the High Limit and Low Limit boxes, enter the high and low limits, or select the Auto Limits check box to have the limits set according to the data source's highest and lowest values.
If you want high and low limits to be retrieved automatically at run-time, select the Fetch Limits check box.
If there are multiple pens, the Apply to all Pens check box is available. Select this check box if you want all pens to have the same high and low limits.
Click OK. The limits changes take effect on the chart. You must save the display for the limits changes to be saved.