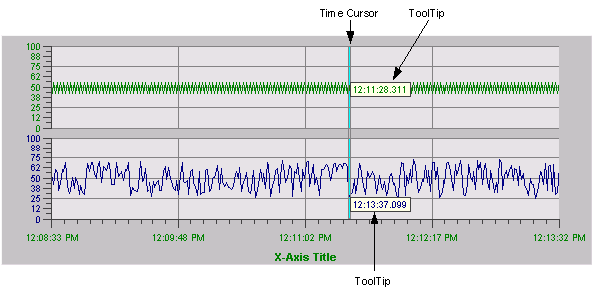
With Proficy Portal, you can choose to display time cursors in the run-time environment. The cursor is a vertical bar in the center of a Time, Event, XY, or Correlation chart that you move left and right by clicking and dragging it with the mouse. The value of each trend under the cursor is shown in the chart's legend. If the cursor does not appear in a chart, you can add it (if the chart allows modifications) by selecting the Show Cursor check box from the Chart tab in the chart's Configuration dialog box.
When you select a cursor, it changes color and a ToolTip appears where the trend crosses the cursor. Depending on the chart's configuration, the ToolTip may show the value, time, and/or date of the point under the time cursor. Multiple time cursors can also be configured (and ToolTips can be used with each time cursor). For more information on ToolTip configuration settings, refer to To configure a pen's Tool Tips in a Time or Event chart, Configuring an Event chart, or Configuring a Correlation chart.
The following figure illustrates a chart configured with two pens, a cursor, and a ToolTip for each pen.

In category charts, a ToolTip appears by default as you move the mouse pointer over data in the chart. You can disable the ToolTip by clearing the Enable check box on the Chart tab. You also have the option of showing or hiding the category, series, and value in the ToolTip. For more information on ToolTip configuration settings, refer to Specify Category chart Tool Tip settings.