If you are exporting Historical data from a Time chart, the data can be exported in two formats:
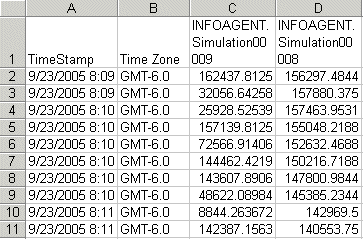
Column Format – in the exported .csv file, the tags appear in columns, and the timestamp appears in rows). This format is suitable for use only when the time for all tags is synchronized. If the tags have different start and end times, or different intervals between data, use the Row format instead.
Row Format – in the exported .csv file, the tags appear in rows, and the timestamp appears in a column).
The following guidelines are recommended when exporting time chart data:
Limit the number of pens per display to 15, otherwise pens may not plot correctly or performance may be compromised.
Limit the number of values for a single tag to 65,526. Microsoft Excel can load a maximum of 65,526 rows, therefore, if you export more than 65,526 rows of data you will have to view it in Notepad or Microsoft Access. However, configuring a display with large amounts of data may compromise Proficy Portal's performance.
Refer to the following figures for examples of each format.
Column Format

Row Format

NOTES:
When time chart data has been exported, and you open the .csv file in Microsoft Excel, the exported value may be truncated or rounded if the value has 12 or more decimal places. To view the actual value, open the .csv file in Notepad or import the .csv file into Microsoft Access.
When time chart data has been exported, and you open the .csv file in Microsoft Excel, the timestamp column is automatically formatted to display only the time. To display the whole date and time value, change the date format of the Timestamp column (using Microsoft Excel), or open the .csv file in Notepad or Microsoft Access.
While in Run mode, right-click the Time chart you want to export data from.
Choose either Export Remote or Export Local depending on whether you want to save the data to your local machine or to a network location. See Exporting Data for more information on Remote/Local options.
Choose Row Format or Column Format. You will be prompted to choose a location to save the file (for Local) and enter a file name.
NOTE: Row/Column options will not be available unless all the data in the Time chart is of the type Historical.
Click Save.
The .csv file is saved to the location you specified.