Charts Properties | Configuring a Time chart
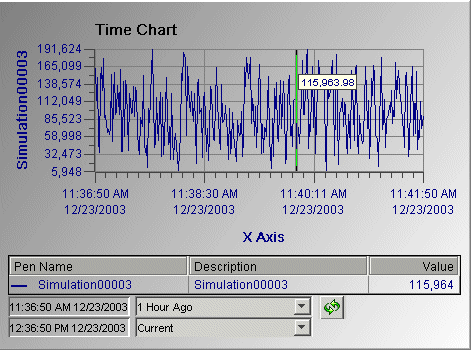
The Time chart plots numeric or string values over a specified time span. Use the Time chart to display trends when the time interval to be analyzed is known. If the time of the data is not known, an Event chart can be used instead of a Time chart for trending purposes.
There are multiple ways to update the time on Time charts. When the start and/or end time is updated on the data source, chart, or display, the associated data for that time is retrieved from the server (if the source data is configured as such). The specific time or time frame does not need to be known when you use the following methods of time update:
Automatic update
Scrolling
Quick Time
Time parameters through a linked object such as the Time Component.
For more information on each of these time update methods, see Time Management.
The following example is a Time chart that trends values over a fixed date and time.
